Understanding Engagement in K-12 Online Courses: Part Two

Authors
Andrew Vanden Heuvel, Michigan Virtual
Kristi Peacock, Michigan Virtual
Kristen DeBruler, Michigan Virtual Learning Research Institute
Anecdotal evidence from course designers and Michigan Virtual School® (now known as Michigan Virtual™) instructors suggested that some students were not fully engaged with their online course materials. There was a commonly held belief by instructional staff and designers that some students were picking and choosing which assignments to do and only did the minimum required to get their desired grade. It was thought that some students were spending only as much time in the course as absolutely necessary and, even when they were in the course, not taking full advantage of all course materials. Part one of our two-part blog series on understanding engagement in K-12 online courses explored our use of Google Analytics (GA) and Hotjar and data gathering approaches. Part two will explore the use of learning management system (LMS) data and discuss implications for instructional designers and instructional staff.
LMS Data
Following both the GA and Hotjar data collection, and with the original problem in mind — better understanding student engagement for the reasons stated previously — we next accessed and analyzed readily available data on assignment completion and performance from the LMS data archive.
One way to think about “engagement” is whether students were accessing and spending time with the lesson materials (which is what GA and Hotjar were able to do), but another way to think about “engagement” is whether students were completing their course assignments. One benefit of looking at engagement in terms of assignment completion is the ability to connect engagement and student performance in their online courses.
To start, we identified the most relevant data in the Blackboard (Bb) database. Our goal was to measure the number of students submitting each assignment in a particular class or term. Given that individual courses have multiple sections and instructors but nearly identical course content, we gathered data across all sections and instructors to get a larger sample. We pulled every item in the Bb gradebook from each section of the particular course. For one course, this dataset included over 2,000 gradebook items for the approximately 50 students enrolled in the course. A screenshot of the data set can be seen in Image 1 below.
Image 1. Screenshot of Bb Gradebook Data Set
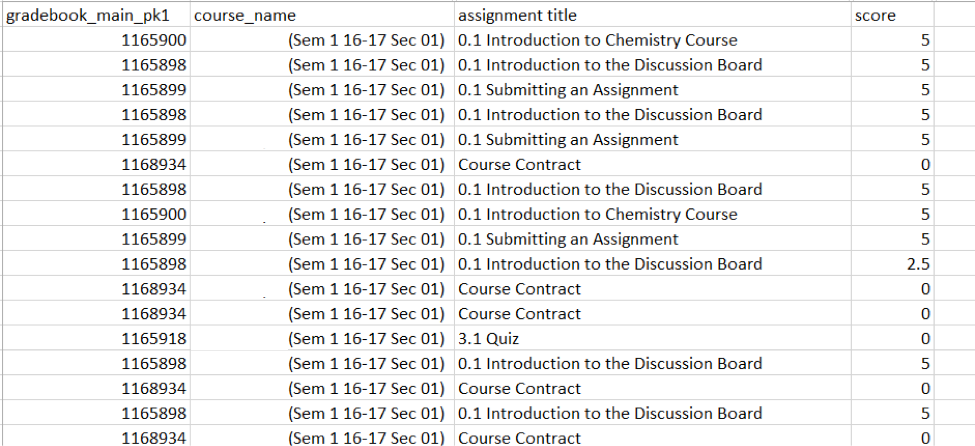
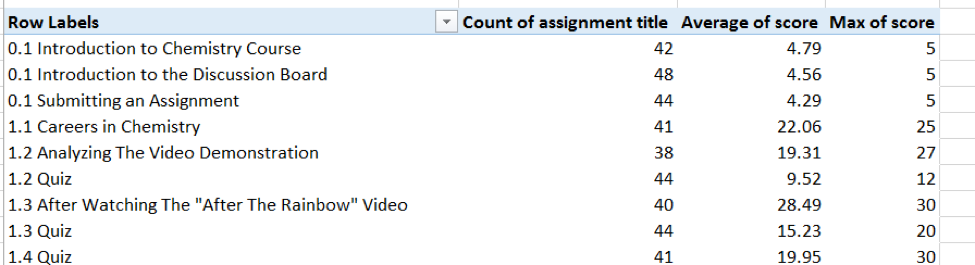
We then used pivot tables in Microsoft Excel to transform the data set into a more useful aggregate. The data was organized so that each assignment was listed only once in a given row. (See image 6 for a screenshot.) The column “count of assignment title” told us how many times this assignment title appeared in our dataset, which told us how many times a student completed this assignment (i.e., the number of submissions). The column “average of score” told us the average performance on this particular assessment item across all sections of the course. The column “max score” noted the number of points possible for the given assignments.
Image 2. Screenshot of Excel Pivot Table Assignment Count and Score
Once the pivot tables were complete, we calculated the average student performance as a percentage. As was true of earlier work, we found graphs to be more easily understood by those within our team and outside. Thus, we created several graphs charting student engagement.
Figure 1. Count of Assignment Submissions by Assessment Item
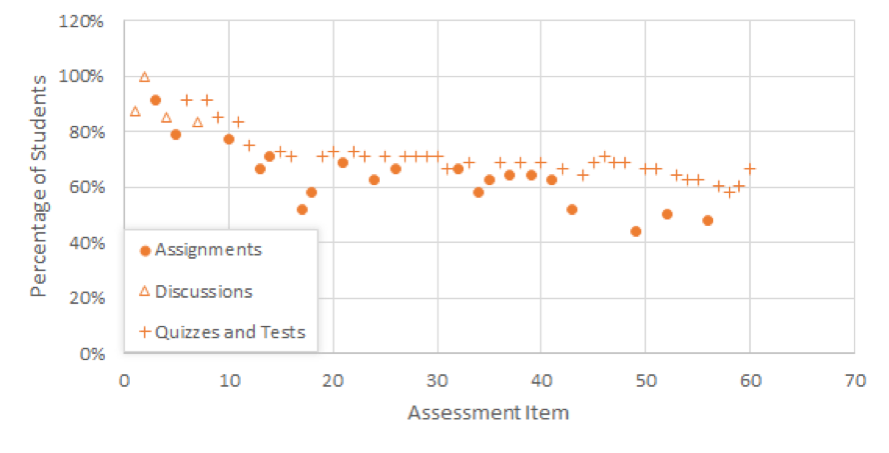
This engagement graph not only showed a steady decline in student participation through the course (higher assessment item number indicates placement later in the course), it also demonstrated that students preferentially skipped some assessments, confirming the assumption held by course designers and instructors that served as the catalyst for this research.
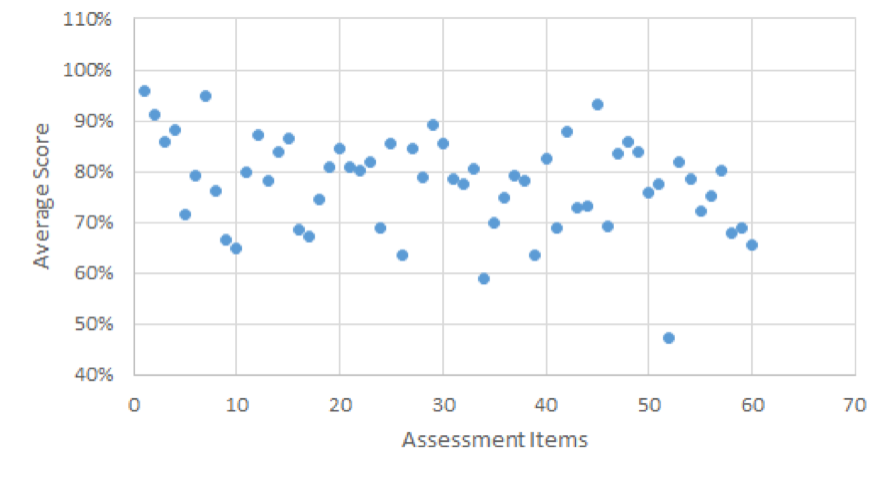
Our previous graph demonstrated that students may have been selectively completing assignments. (Consistent completion would have been demonstrated by a horizontal line of dots at the level of the number of students enrolled in the course; several dots are below the relatively stable line of approximately 30 submissions.) We next wanted to know if student performance also varied by assignment. By graphing the average student score by assessment title, we determined how student performance fluctuated and identified assignments where students typically excelled or struggled. This data was invaluable as it clearly identified areas of improvement for our courses and/or instructional methods.
Figure 2. Average Score of Assignment Submissions by Assessment Item
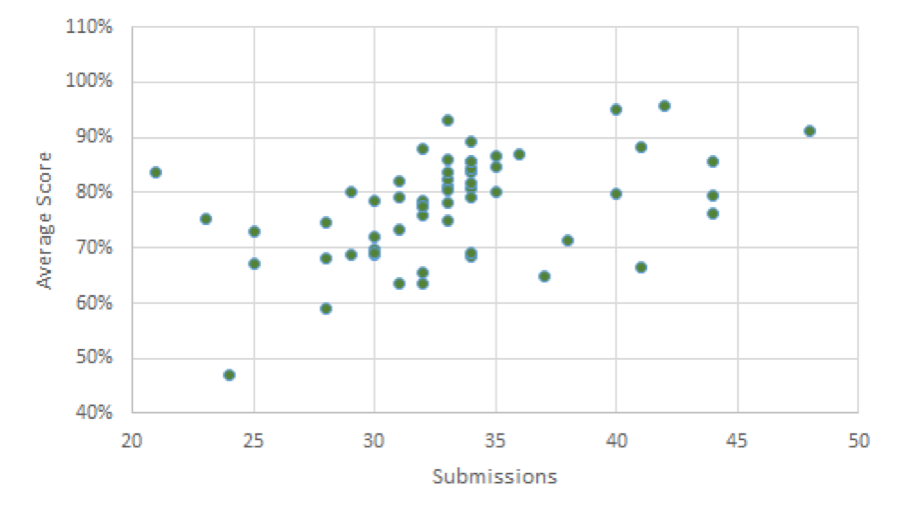
Finally, we were able to combine student engagement and performance to identify assessment items that were outliers in either or both. In Figure 3 below, each dot represents a specific assessment item in the course. By plotting each assignment this way, we were able to identify high engagement/high-performance items (such as the “Introduction to the Discussion Board” assignment, the dot in the far upper right) and low engagement/low-performance items (such as “7.2 What’s in My Name?”).
Figure 3. Average Score by Count of Assignment Submissions
Discussion
Our original work started with the question of how students engage with their online courses and course materials. To answer that question, we used (what were to us) complex methodologies. We were able to partially answer our question through GA and Hotjar and developed a better understanding of “engagement;” but as much as we tried to customize and “fit” GA and Hotjar to our needs, it was never quite right. Our final attempt — the use of readily available LMS data — was by far the most successful and, more importantly, the most useful.
One unanticipated yet positive side effect of our work has been the natural and fruitful collaboration between the instructional design team and instructional staff. This work has created a cyclical, closed-loop system in which designers identify problems within courses, work with instructional staff to develop and implement solutions, and bring those solutions back to the designers to implement in other courses or on a larger scale.
We originally sought a simple solution to a complex problem, one that we could easily collect, compile, and, most importantly, share with instructional staff at all levels. And it was in this final step — the sharing of our work — that we found the most value. Sharing our findings, particularly figures 1, 2 and, 3, led to numerous suggestions of simple interventions, interventions that do not incur prohibitive financial or time costs. Sharing our findings and the resultant discussions led to the idea of tiered interventions. For example, course assignments with the lowest engagement and performance could be flagged by the instructional design team for immediate review. Assignments with low engagement but medium/high performance could be flagged for course instructors who could, in turn, send announcements to students about the upcoming assignment. Should this prove to be an ineffective strategy to increase engagement, the entire instructional team could meet to discuss the possibility of calibrating the point value to incentivize students to complete the assignment. Should graphs like those presented in the figures above prove useful, they can be made easily available to instructional staff on a large scale.
It is worth noting here that the goal of increasing engagement is not to simply increase the amount of time students spend in a course, or to have them complete course activities for the sake of “doing work.” Rather each of our courses are very deliberately designed by instructional designers; and all the activities, assignments, quizzes, discussion boards, and exams are chosen because they have instructional value. The courses are not filled with “busy work,” but rather with activities created to help students learn and understand complex topics. As such, our goal is to have all students engage with the assignments (learn the desired course material) and do well on the assignments (master the course material).
Michigan Virtual Learning Research Institute
The Michigan Virtual Learning Research Institute (MVLRI) is a non-biased organization that exists to expand Michigan’s ability to support new learning models, engage in active research to inform new policies in online and blended learning, and strengthen the state’s infrastructures for sharing best practices. MVLRI works with all online learning environments to develop the best practices for the industry as a whole.
Related Posts

Understanding How Students and Teachers Think About Responsible AI Use: An Interview with a Researcher
Students and teachers generally understand the risks of AI misuse, but they are less clear about what responsible AI-supported learning should look like in practice. This interview highlights findings from a Michigan Virtual study showing that students need clearer examples, consistent expectations, and practical guidance for using AI transparently and appropriately in schoolwork.

What Happens to Students' Online Course Scores After the Course Ends?
The moment an online course ends, a new question begins: how will that score be recorded locally? Drawing on a 2025 brief and a small follow-up survey, this blog post outlines three common approaches districts use to interpret and record students’ online course scores and why the differences can matter for students.

Out of Order, Still Out of Reach: Variations in Pacing among World Language Students
Cuccolo & Green’s (2025) report highlighted the relationship between students’ assignment submission patterns and final course scores. Given that pacing has important implications for student performance, knowing what assignment submission patterns look like across schools with varying demographics could help prompt early identification and intervention. As such, this blog explores students’ assignment submission patterns based on school-level demographic information.

From Curiosity to Career: Exploring Possibilities with VR
Explore how immersive VR simulations helped students step into real-world roles: from EMTs to chefs, all without leaving the classroom.

Out of Order, Still Out of Reach: An Interview with a Researcher
In this blog, MVLRI researchers synthesize the key findings from two research studies about student assignment submission patterns in Michigan Virtual online courses.

Understanding Teacher-Student Communication in Online Courses: An Interview with a Researcher
In this interview, MVLRI researchers discuss key findings from a report highlighting how personalized, consistent, and timely communication in online courses can help students feel more connected to their online teachers and may also impact their success in the course. This blog also explores practical strategies for communicating effectively and building relationships with online students.