Michigan Virtual Teacher Professional Learning Community Design Research Blog, Part 1
Introduction
Throughout the 2016-2017 academic year, the instructional design and Michigan Virtual Learning Research Institute (MVLRI) staff at Michigan Virtual recorded in-depth analytics data to monitor how students engaged with instructional content within two Michigan Virtual School courses. The result of that work has been previously summarized in these two blog posts:
- Understanding Engagement in K-12 Online Courses: Part One
- Understanding Engagement in K-12 Online Courses: Part Two
Our effort to understand and improve student engagement expanded during the 2017-2018 school year through the creation of a year-long action research professional learning community (PLC), including instructional designers, professional learning staff, MVLRI researchers, and the lead instructors from each academic department across Michigan Virtual School. The primary goal of this PLC was to increase student engagement and performance on specific individual assessments through action research and targeted interventions.
Instructors in the PLC were provided with basic engagement and performance data from the previous academic year. This data included the average score and number of submissions for each assessment in over 30 different online courses. A sample of the data provided to participants is shown below.
| Assessment Title | Submissions | Mean | Max | Average Score |
|---|---|---|---|---|
| 0.1 Message Your Instructor | 77 | 5.0 | 5.0 | 100% |
| 0.2 Introduce Yourself | 74 | 4.928 | 5 | 98.6% |
| 0.3 Intro Assignment – Submitting Files | 70 | 4.321 | 5 | 86.4% |
| 1.1 Quiz | 75 | 4.493 | 5 | 89.9% |
| 1.2 – 1.3 Quiz | 75 | 4.467 | 5 | 89.3% |
| 1.2 Effect of Environment Gizmo | 71 | 8.284 | 10 | 82.8% |
| Unit 1 Project | 73 | 23.023 | 30 | 76.7% |
| Unit 1 Test | 74 | 13.811 | 15 | 92.1% |
In contrast to the in-depth analytics data collected in our previous efforts, this data was pulled directly from the learning management system (LMS) databases before being anonymized, averaged, and presented to the PLC instructors. By pulling data directly from the LMS, we could compare student engagement and performance across many different sections, semesters, and school years even if no special analytics or tracking software had been deployed in those courses.
As facilitators of the PLC, our goal was to help the participants develop the knowledge and skills necessary to be disciplined researchers of their own practice. Toward that goal, we provided a general structure for the participants to:
- Identify their own problem to solve
- Postulate a reason why this problem may be arising
- Propose a solution that they are capable of developing
- Implement the proposed intervention
- Evaluate the success of the intervention
- Publish their results to the greater education community
This two-part series of blog posts represents the completion of the action research process for each of our participants. Each post will walk through a specific problem addressed by one of our participants and will provide student data collected both before and after the intervention as well as an analysis of the effectiveness of the proposed solution. Part two will conclude the series with a discussion of summary reflections and plans to continue this research in upcoming years.
We facilitators are immensely proud of the participants’ work over the past year, particularly that of the lead instructors who demonstrated that online educators are well-equipped to be disciplined researchers of their own teaching.
Annette Gleason
Algebra 1B
This course is the second in a two-course sequence. In the course, students will learn about algebraic concepts such as integers, linear equations, inequalities and factoring.
The Problem
In the Algebra 1B course during the 2017 Spring Semester at Michigan Virtual, there was a common trend for all discussion board assignments to have low engagement compared to other course activities. The discussion board with the lowest number of submissions was in Unit 8; data taken from the course showed the Unit 8 Discussion Board had a 72% attempt rate.
The Change Idea
In order to address the low engagement in the Unit 8 Discussion Board, updates to section one (in which Unit 8 resides) of the Algebra 1B course were made during the spring 2018 semester. There was an assumption that students did not complete the Unit 8 Discussion Board because, unlike most of the other activities in Algebra 1B, the Unit 8 Discussion Board was not required to proceed to the next unit. For a majority of activities in the Algebra 1B course, students must achieve 60% or higher on an assignment before the next set of lessons will be “opened” (also known as “adaptive release”) for that student. For this project, the Unit 8 Discussion Board assignment became a required task by setting Checkpoint 8.9-8.10 to be adaptive release based on a submission on the discussion board.
While investigating the Unit 8 Discussion Board, the teacher found that the content in the associated lesson was difficult for students. To address this, a supplemental resource was created in H5P and placed within the discussion board instructions. Additionally, instructions directing students to solve five equations were changed to only require three. An increase of 10% participation, bringing the total to 82%, was expected.
The Results
There were 39 students enrolled in the first section of Algebra 1B during the spring semester 2018. (This total does not include those students who dropped or withdrew from the course.) Of these, 28 students completed the Unit 8 Discussion Board Assignment, resulting in an overall Unit 8 Discussion Board submission rate of 72%. Total engagement did not increase by the expected 10%. However, only 28 (of the original 39) students completed the course through to the final exam. Of these 28 students who completed the course, all of them submitted the required work to the Unit 8 Discussion Board.
Jaci Hartman
Chemistry B
This is the second course in a two-course sequence. This course is designed to meet both the Michigan Content Standards for Chemistry (Michigan Merit Curriculum) and the literacy standards of Common Core State Standards for Science and Technical Subjects. It continues the study of chemical reactions with calculations in chemical reactions, rates of reactions, reactions equilibrium, and redox reactions. Other topics include phases of matter, acids and bases, nuclear chemistry, and organic chemistry.
The Problem
Chemistry teachers have always known that stoichiometry is one of the toughest units for a first year chemistry student; this was confirmed by data gathered from the 2016-17 school year. The score of the first quiz (9.1) is the starting point for stoichiometry and often reflects students’ overall success in the stoichiometry unit. Figure 1 illustrates that the average score for the 9.1 Quiz is one of the lowest in the entire course.
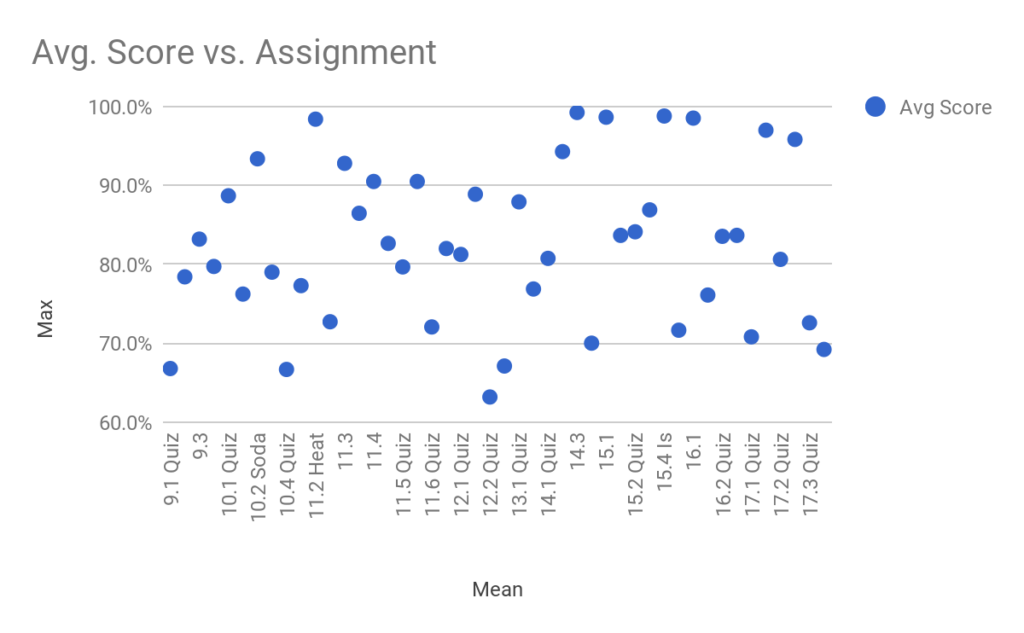 Figure 1. Average score by assignment in Chemistry B
The Change Idea
With an average score of 66.8%, the topic and quiz needed to be examined to raise student understanding and performance. Prior to the semester, an additional practice assignment that received a grade and feedback from instructors was placed into the course. To further these efforts, an instructor video was made and placed in the lesson content. The instructor video spent more time reviewing the concept of mole ratios and demonstrating example problems that were scaffolded from the most basic of problems to more advanced problems. Students were also provided a graphic titled the Mole Road Map to help demonstrate the relationship between moles and other quantities in chemical reactions and help guide problem solving for practice problems.
The Result
Near the end of the semester, data were pulled to compare the section that was tested to the previous year’s scores. It was found that the average score of the quiz improved by 3.4%. Even more notable, the median score had a 12% improvement.
| Assessment Title | Submissions | Median | Mean | Max | Avg Score |
|---|---|---|---|---|---|
| 9.1 Quiz | 35 | 19 | 16.16 | 23 | 70.2% |
| 9.2 Quiz | 32 | 20 | 17 | 22 | 85% |
| 9.3 Combustion of Acetylene Lab Analysis | 19 | 22 | 20.21 | 26 | 77.7% |
| 9.3 Quiz | 29 | 36 | 29.59 | 40 | 73.9% |
An argument can be made that the median score gives a better representation of overall student achievement, as the average score takes into account students who did not take the quiz and therefore have a score of 0. Students were also surveyed in order to gain an idea of how many took advantage of the video provided as an additional resource before taking the quiz. Twenty students responded to the survey and of those, 95% watched the video. Sixty-five percent of the students found the video to be helpful while another 30% found the video to be somewhat helpful. Five percent of students either did not watch the videos or did not find them helpful.
The conclusion has been drawn that the addition of the video resource and Mole Road Map, as well as additional practice assignment with teacher feedback, was helpful and should be included in all sections of Chemistry B going forward.
Alanna Prieditis
Spanish 1B
This course is the second in a two-course sequence. Unlike some language courses that focus on grammar rules, vocabulary lists, and situation dialog, this course emphasizes receptive knowledge: students listen, read, write and practice spontaneous, natural speaking in Spanish.
The Problem
The 06.03 “Setting the Table Quiz B” in Spanish 1B has high engagement but a very low average score (62.8%) compared to other unit 6 assessments. This particular quiz also falls in the top 5 lowest average score assignments of the entire course. It is the only one of these five assignments that does not have a pretest.
The Change Idea
The 06.03B quiz covers a novel and historically difficult concept: direct object pronouns. Based on placement in the unit and course, it is thought that students may not have ample time to practice direct object pronouns before the 06.03B quiz. The change idea was to create some additional practice opportunities and offer alternative strategies for remembering the direct object pronouns in Spanish. An Edpuzzle video was embedded directly before the 06.03B quiz in Blackboard to give students extra practice. The Edpuzzle video is a catchy song designed to help students remember what the different direct object pronouns are and includes embedded comprehension question checks.
The Results
This sole intervention did not appear to have had an impact in raising scores on the 06.03B quiz. In the two courses in which the change idea was implemented, one course had a slight increase in quiz score average at 63.8% (in comparison with the original 62.8% score) while the other course had an extremely low quiz score average at 42.2%.
The Edpuzzle intervention used a catchy song to help students remember what the direct object pronouns were in Spanish with a couple of comprehension checks of using them in context. After doing a deep analysis of the common mistakes/misconceptions made on many of the quizzes, it can be determined that more application practice (and possibly an association with similar grammatical concept in English) is what is actually needed. On the quiz, students appeared to be able to recall a real Spanish direct object pronoun option for fill-in-the-blank responses, but then seemed to be matching it to the subject of the sentence instead of the actual direct object it is supposed to take the place of. This change idea that focused more on a memorization strategy for the various direct object pronouns in Spanish didn’t offer the in-depth explanation about what the purpose of the direct object pronoun is and how it is to be used within a sentence which is what students really needed and struggled with on the quiz.
Liz Hoopfer
AP Calculus AB and BC
This course is the first semester of a two-semester sequence. The course is aligned to the Advanced Placement curriculum for Calculus AB and covers calculus principles such as derivatives, integrals, limits, approximation, and applications and modeling.
The Problem
The AP Calculus courses, both AB and BC, have assignments delivered on two platforms: Blackboard and WebAssign. The majority of the homework assignments are done in WebAssign, with a small handful of assignments and all unit tests conducted live in Blackboard. Based on data provided, many students skip or do not submit the Blackboard homework assignments in both courses. This could be due to a handful of reasons, including but not limited to: these assignments are forgotten because students might save WebAssign as a separate bookmark in their browsers; the Blackboard assignments do not provide immediate feedback, as the WebAssign homework assignments do; the Blackboard assignments typically require more time to complete; and the Blackboard assignments seem more difficult as they are longer and require students to justify their answers.
The Change Idea
To ensure students at least remembered to acknowledge these Blackboard assignments, the change idea was to force students to mark each assignment they completed in a check list of all assignments from that unit before the student could access the unit test. The unit test was set to adaptive release upon submission of this checklist. This list also lived in Blackboard, so students would already be present in the platform we wanted them to spend more time in.
The Result
The results for this term were a bit skewed for a handful of reasons. For the first two units, most of the students completed the assignments in order, so this checklist did not serve as a reminder to these students to “go back and do these other assignments.” Based on assignment submission time between the checklist and the Blackboard assignment, of the three students who had skipped at least one of the Blackboard assignments, the checklist seemed to remind two of them to complete these other assignments. This checklist, it seemed for the first two units, served its purpose.
However, these students were not getting to the checklist until the evening that the unit’s work was due. As the unit tests were worth far more points than the assignments in the course, students opted to complete the unit test first. Some had time to go back to the older assignments, while others chose not to submit these at all.
The last two units, though, were more difficult to interpret. The Blackboard homework assignments had different due dates than the checklist and unit test, so most students completed these other assignments on time, at least a week before the checklist or unit test. The students who missed the other Blackboard assignments did not end up turning them in, regardless of the checklist. This could be due to the time crunch issue mentioned above but also could be a misinterpretation of the late policy in the course. The due dates and late policy shifted between semesters one and two, so a confounding variable could be that students might not have known they could turn in the missing work for a reduced score (instead of a zero).
Overall, the checklist seemed to serve as a good reminder and could be of use in future semesters, but, in reality, the actual value of the checklist is dependent on the group of students (most AP students are diligent workers), the due dates of these assignments, and a change in platform. There are currently wheels in motion to move the homework assignments out of WebAssign and into Blackboard permanently going forward, so this issue might not even exist once all assignments live in a single platform.
Kristin Koch and William Springer
American Sign Language 2B
This is the second course of the second year of ASL courses. The course continues to focus on useful communication that students should be able to carry out in ASL. Students study the basic signs and phrases, techniques, and cultural nature of the language. This course introduces the students to the new concept of conceptually accurate signing that places emphasis on awareness of differences between ASL and English.
The Problem
Looking at the data for American Sign Language 2B, one of the largest drops in student engagement was for the Mid Term Report Writing assignment. There were many students who completed the midterm receptive exam which takes place right before the midterm report. We noticed a large drop in the number of students who completed the midterm report versus those who were taking the midterm receptive exam. Our data showed that only 66% of students were attempting to complete this project. This assignment is worth 80 points, so students who do not complete it are missing out on a substantial chunk of points when they choose not to do this item.
The Change Idea
After reviewing our data, we took a deeper look into this particular assignment to see what might cause students to skip it. After reviewing the directions for this particular assignment, we recognized that the project is very involved with many different components. After reviewing all of the directions and the template that students are to follow, students likely look at the depth of this task and simply shy away from it, particularly if they are behind pace. For example, the template that students fill out is three pages long, and this is only one part of the directions they are to follow to complete this part of the midterm essay. After reviewing the assignment further, we noticed the assignment started by addressing a few Deaf cultural components but then went into a deeper geographical research paper type of assignment. We felt this turned students away from the purpose of the assignment overall, so we decided to focus the assignment completely on the Deaf cultural aspects with only a small overall geography lesson added in. Fortunately, since this ASL 2B course was already undergoing an update, we were able to edit the actual midterm project within the course. Several of our PLC colleagues opted to introduce interventions on the individual instructor end, but our intervention involved an actual edit in the course content.
The Result
The goal we set for completion of this assignment was 78%. This completion rate is slightly lower than the Receptive (multiple choice) portion of the midterm which has an 87% completion rate, but still much higher than it previously was for this item; thus, we feel it’s a realistic increase. Previously, 118 out of 178 students were attempting to complete this midterm project (66%). After implementing our change idea for Trimester 3, we saw a 7% increase. Twenty-four out of 33 students completed the midterm project (73%). Although our student sample size for Trimester 3 was significantly smaller than our original data set, we anticipate that we'll see a similar percentage of completion when the sample size is larger in Semester 1 of the 2018-2019 school year.
Michigan Virtual Learning Research Institute
The Michigan Virtual Learning Research Institute (MVLRI) is a non-biased organization that exists to expand Michigan’s ability to support new learning models, engage in active research to inform new policies in online and blended learning, and strengthen the state’s infrastructures for sharing best practices. MVLRI works with all online learning environments to develop the best practices for the industry as a whole.
Related Posts

Understanding How Students and Teachers Think About Responsible AI Use: An Interview with a Researcher
Students and teachers generally understand the risks of AI misuse, but they are less clear about what responsible AI-supported learning should look like in practice. This interview highlights findings from a Michigan Virtual study showing that students need clearer examples, consistent expectations, and practical guidance for using AI transparently and appropriately in schoolwork.

What Happens to Students' Online Course Scores After the Course Ends?
The moment an online course ends, a new question begins: how will that score be recorded locally? Drawing on a 2025 brief and a small follow-up survey, this blog post outlines three common approaches districts use to interpret and record students’ online course scores and why the differences can matter for students.

Out of Order, Still Out of Reach: Variations in Pacing among World Language Students
Cuccolo & Green’s (2025) report highlighted the relationship between students’ assignment submission patterns and final course scores. Given that pacing has important implications for student performance, knowing what assignment submission patterns look like across schools with varying demographics could help prompt early identification and intervention. As such, this blog explores students’ assignment submission patterns based on school-level demographic information.

From Curiosity to Career: Exploring Possibilities with VR
Explore how immersive VR simulations helped students step into real-world roles: from EMTs to chefs, all without leaving the classroom.

Out of Order, Still Out of Reach: An Interview with a Researcher
In this blog, MVLRI researchers synthesize the key findings from two research studies about student assignment submission patterns in Michigan Virtual online courses.

Understanding Teacher-Student Communication in Online Courses: An Interview with a Researcher
In this interview, MVLRI researchers discuss key findings from a report highlighting how personalized, consistent, and timely communication in online courses can help students feel more connected to their online teachers and may also impact their success in the course. This blog also explores practical strategies for communicating effectively and building relationships with online students.