Background
Automatic grading is a pedagogical tool with the dual advantages of reducing teachers’ workloads and providing instant feedback to students, and has been used in many subjects, including computer science (Sherman, Bassil, Lipman, Tuck, & Martin, 2013), science (Wang, Chang, & Li, 2008), and English Language Arts (ELA; Wilson, 2018). Alongside the growing popularity of Massive Open Online Courses, it has become even more prevalent in online courses than in face-to-face ones (Kay, Reimann, Diebold, & Kummerfeld, 2013). However, the effects of automatic grading on students’ learning outcomes in online high-school courses are not yet clear.Accordingly, the purpose of this study is to examine the under-researched relationship between a range of variables associated with auto-graded coursework, on the one hand, and student performance, on the other.Its research questions are as follows:
Did students in courses with a high proportion of auto-graded work obtain higher grades than those in courses with a low percentage of such work?
Within each of these two grading methods, how well do points earned and points attempted predict student performance?
Methods
Research Site
This study utilized a dataset covering all students enrolled in ELA courses in 2017-18 at an accredited state-wide virtual school in the Midwestern United States.
Data
Initially, the data included 864 enrollments in the 2017-18 courses mentioned above. After excluding students who withdrew from their courses (n=16) or dropped them (n=110), this yielded a sample size of 738 enrollment records pertaining to 505 students.Enrollments by completion status. Among the 738 course completions that will be utilized for further analysis, the number of passes was 604 and the number of fails, 134.Enrollments by student. None of the 505 individuals who completed their enrollments were enrolled in more than five courses during the school year in question, and only 2% of them took three or more courses, as shown in Table 1.Table 1.
Enrollment | Frequency | Percentage |
|---|---|---|
1 | 296 | 58.61 |
2 | 199 | 98.02 |
3 | 7 | 99.41 |
4 | 2 | 99.8 |
5 | 1 | 100 |
Number of Enrollments per StudentStudents by gender. Among the 505 sampled students, 299 (59.2%) were females and 206 (40.8%) were males.Class size. The target enrollments were distributed across 27 course sections, which on average each had 27.33 students (SD=14.66).Distribution of grades by section. Across all course sections, the average final score was 71.26 (SD=28.44).Table 2.
Course ID | Course Title | Students | Final Score |
|---|---|---|---|
18807 | American Literature A: English 11-12 | 37 | 71.42 |
18808 | American Literature A: English 11-12 | 37 | 78.50 |
18809 | American Literature A: English 11-12 | 43 | 73.46 |
18810 | American Literature A: English 11-12 | 11 | 82.31 |
19692 | American Literature A: English 11-12 | 36 | 60.50 |
18812 | American Literature B: English 11-12 | 12 | 70.89 |
19693 | American Literature B: English 11-12 | 44 | 80.51 |
19694 | American Literature B: English 11-12 | 52 | 73.25 |
19695 | American Literature B: English 11-12 | 34 | 73.49 |
18878 | British Literature A: English 11-12 | 44 | 81.56 |
18879 | British Literature A: English 11-12 | 24 | 69.49 |
18880 | British Literature A: English 11-12 | 8 | 58.53 |
19728 | British Literature A: English 11-12 | 23 | 71.60 |
18882 | British Literature B: English 11-12 | 17 | 65.72 |
19729 | British Literature B: English 11-12 | 44 | 74.29 |
19730 | British Literature B: English 11-12 | 34 | 78.71 |
19731 | British Literature B: English 11-12 | 3 | 85.73 |
18913 | English 10A | 29 | 70.16 |
18914 | English 10A | 23 | 70.90 |
19777 | English 10A | 13 | 30.06 |
18916 | English 10B | 10 | 50.26 |
19778 | English 10B | 24 | 72.93 |
19779 | English 10B | 43 | 55.40 |
18918 | English 9A | 35 | 74.06 |
19780 | English 9A | 7 | 41.73 |
18920 | English 9B | 7 | 64.46 |
19781 | English 9B | 44 | 76.94 |
Final Scores by Course Section
Measures
Types of graded work by course. As used in this paper, the term “piece of graded work” is defined as any discrete item that can be marked. Thus, on an auto-graded quiz, the term is applied to the answer to each question, not to the whole quiz. Likewise, on an instructor-graded test consisting of short-answer responses, a “piece of graded work” would mean any one of the answers, but not the whole test. An essay, however, is treated a single “piece of graded work.”Unsurprisingly, small differences – including in assessment methods – were found among different sections of the same courses. Therefore, to calculate descriptive statistics at the course level, data were first aggregated to the section level. Hereafter, the term “count” will be used to refer to the number of auto-graded and instructor-graded pieces of work in a given course. Across all the sampled courses, the mean auto-graded count was 72.1 and the mean instructor-graded count, 49.3; and auto-graded work represented 57.5% of all work.Points earned. Five measures relating to points earned were calculated. The first was “max points”, referring to the maximum number of points that all the auto- or instructor-graded work in a given course was worth. The average max points figure for auto-graded work was 86.8, while that for instructor-graded work was 755.75 points.The second, “% of max points”, was the percentage of all available points that each grading category represented, regardless students completed it or not. For auto-graded work, it was 10.2%, while for instructor-graded work it was 89.8%.Third, “points earned” comprised the number of points each individual student earned by correctly completing a piece of work of either grading type. In light of the above-mentioned slight differences in the sections within each course, points earned were first aggregated to section level, and then aggregated to course level. The average student in the sample earned 55.1 points from auto-graded work, and 523.1 points from instructor-graded work.Fourth, “% of points earned against all” was calculated as the points earned for each piece of work divided by max points, to illustrate the composition of final grades by grading type. Auto-graded work represented 6.5% of max points, and instructor-graded work, 62.2%.[1]Lastly, “% of points earned within type” consisted of the points earned within each grading category, divided by the max points for that category. On average, students earned 60.3% of the points available on their courses’ auto-graded work, and 69.4% of the points available on their instructor-graded work.Points attempted. Additionally, “points attempted” indicated the number of points students tried to gain at the course level in each grading category, regardless of their success. Across the whole sample, average points attempted was 77.6 (auto-graded) and 577 (instructor-graded). “% of points attempted within type” was also calculated – with “type” referring to grading category – as 88.2% in the auto-graded category, and 69.4% in the instructor-graded category. Finally, “% of points attempted earned within type” refers to the proportion of points attempted that students actually received in each grading category. On average, the sampled individuals earned 69.4% of auto-graded points attempted, and 88.7% of instructor-graded points attempted.Table 3.
Measures | Type | Mean | SD | Min | Max |
|---|---|---|---|---|---|
# pieces of work | Auto | 72.14 | 30.21 | 43 | 126 |
Instructor | 49.25 | 6.52 | 41 | 58 | |
% pieces of work | Auto | 57.47 | 10.86 | 46.30 | 75.45 |
Instructor | 42.53 | 10.87 | 24.55 | 53.70 | |
Max points | Auto | 86.80 | 35.39 | 50 | 148 |
Instructor | 755.75 | 80.08 | 665 | 872 | |
% of max points | Auto | 10.23 | 3.98 | 5.93 | 17.90 |
Instructor | 89.79 | 3.99 | 82.13 | 94.07 | |
Points earned | Auto | 55.14 | 30.33 | 22.66 | 109.20 |
Instructor | 523.09 | 71.51 | 426.30 | 650.50 | |
% of points earned against all | Auto | 6.48 | 3.45 | 2.53 | 13.19 |
Instructor | 62.20 | 6.67 | 54.51 | 72.14 | |
% of points earned within type | Auto | 60.27 | 12.62 | 42.67 | 78.80 |
Instructor | 69.43 | 8.14 | 57.96 | 78.20 | |
Points attempted | Auto | 77.62 | 34.14 | 41.82 | 135.00 |
Instructor | 576.99 | 84.26 | 468.00 | 732.20 | |
% of points attempted within type | Auto | 88.18 | 7.40 | 76.03 | 94.94 |
Instructor | 69.43 | 8.14 | 57.95 | 78.20 | |
% of attempted points earned within type | Auto | 69.44 | 9.60 | 56.55 | 82.92 |
Instructor | 88.73 | 3.63 | 81.3 | 93.82 |
Descriptive Statistics of Grading Approaches across Courses
Data Analysis
Stata 13 software was used to perform all the quantitative analyses for this study. To answer the first research question, regarding the relationship between student performance and the composition of auto-graded work, hierarchical linear modeling (HLM) with likelihood estimates was performed, within which level 1 was the student and level 2, the course. A series of two-level models were fit. Model 1 was the unconditional model, showing overall course-related random effects. As their respective level-2 variables, Model 2 included the count of auto-graded pieces of work; Model 3, the proportion of work that was auto-graded; Model 4, max points on auto-graded work; and Model 5, the percentage of all points represented by auto-graded work. Model 6 added both the percentage of auto-graded work and that of all points represented by auto-graded work as level-2 variables. However, the number of auto-graded pieces of work and the maximum points on auto-graded work were not included in Model 6, to avoid multicollinearity.[2]To answer the second research question, regarding the predictive power of points earned and attempted, chi-square automated interaction detection (CHAID) was performed using Stata’s CHAID module. This decision-tree technique is commonly used to discover the relationships among variables by iteratively searching for the split points of independent variables and merging them together to arrive at the best-fitting model. Given that this study had no a priori hypothesis regarding the relationship between its independent variables and student performance, CHAID was an appropriate tool for providing initial insights into such relationships. After the decision trees were created, Model 7 used multiple variables related to points earned, by grading type; Model 8, multiple variables related to points attempted, also by grading type; and Model 9, all the variables that were identified as significant by Models 7 and 8. The dependent variable in Models 7, 8 and 9 was whether students passed their course or not.
Results
Proportion of Auto-graded Work
Despite the total amount of auto-graded work in the sample being higher than that of instructor-graded work, the former represented a much lower percentage of all points. This was because the average piece of auto-graded work was worth just 1.2 points, as compared to 15.4 points for its instructor-graded counterpart. In addition, the proportion of auto-graded work within a given course varied widely, from a low of 46.3% to a high of 75.5%; and the spread in the proportion of instructor-graded work was almost identical, ranging from 24.6% to 53.7%.The percentage of all points earned on auto-graded coursework by the maximum points available ranged from 2.5 to 13.2 (SD=3.45), and on instructor-graded work, from 54.5 to 72.1 (SD=6.67), indicating that the variation in points earned was smaller in the former grading category. This is not surprising, as many more points were available within instructor-graded work. However, when looking at the percentages of points earned within each such category, auto-graded work exhibited a wider variation (SD=12.62) than instructor-graded work did (SD=8.14). Students attempted to obtain a higher percentage of the available points when auto-grading was used (M=88.2, SD=7.40), yet earned a higher percentage of points from their instructor-graded work (M=69.4, SD=8.14), because in the latter case, a higher percentage of the points attempted were awarded. In other words, the fact that students attempted more points on their auto-graded coursework might not have contributed much to their final grades.
Comparison of Courses with High and Low Percentages of Auto-grading
Model 1, the unconditional model, estimated overall mean attainment across courses as 69.7% of max points (see Table 4). The between-course (level-2) variance in attainment was estimated as 75.9 points, and the within-course/between-student (level-1) variance in attainment as 748.3 points. Total variance, computed as the sum of between-course and within-course/between-student variance, was therefore 824.2. Intraclass correlation, or ICC (i.e., between-course variance divided by total variance) was 0.092, indicating that 9.2% of the observed variance in attainment was attributable to differences between courses. It should be noted here that the dataset did not include entry scores, so this course effect was not value-added.Models 2 through 5 were created to examine the effects on student attainment of four variables relating to auto-grading: i.e., the amount of auto-graded work, the proportion of auto-graded work, the maximum points obtainable via auto-graded work, and the percentage of all points that could be obtained via auto-graded work. None of these variables was a significant predictor of student attainment. Model 6, which included the proportion of auto-graded work and the percentage of all points represented by such work, also contained no statistically significant coefficients.Table 4.Note:p
Final Grades | |||||||
|---|---|---|---|---|---|---|---|
Model 1 | Model 2 | Model 3 | Model 4 | Model 5 | Model 6 | ||
Quantity of auto-graded work | 0.115 | ||||||
(0.0775) | |||||||
Proportion of auto-graded work | 0.346 | 0.236 | |||||
(0.209) | (0.284) | ||||||
Maximum points on auto-graded work | 0.0887 | ||||||
(0.0626) | |||||||
Percentage of all points represented by auto-graded work | 0.888 | 0.444 | |||||
(0.582) | (0.779) | ||||||
_cons | 69.65*** | 69.73*** | 69.75*** | 69.76*** | 69.81*** | 69.80*** | |
(2.037) | (1.952) | (1.926) | (1.966) | (1.950) | (1.917) | ||
Level 2 Variance | 75.92*** | 67.17*** | 64.64*** | 68.61*** | 66.94*** | 63.67*** | |
(17.03) | (15.70) | (15.38) | (15.73) | (15.48) | (15.13) | ||
Level 1 variance | 748.3*** | 748.4*** | 748.6*** | 748.2*** | 748.4*** | 748.6*** | |
(19.93) | (19.94) | (19.95) | (19.92) | (19.93) | (19.94) | ||
HLM Analysis, Effects of Auto- and Instructor Grading on Final Grades Standard errors in parentheses; *** <0.001
Points Earned and Attempted by Type
Model 7 used multiple variables regarding points earned by each grading type, and the results of CHAID suggested a three-cluster solution (see Fig. 1). These three clusters were separated by two variables: the percentage of all points that was earned from instructor-graded work, and the total points earned from instructor-graded work. The first cluster, depicted in the bottom left corner of Figure 1, implies that if a student received below the median percentage of points earned on instructor-graded work (i.e., 67.6%) and also below the median number of points earned on such work (i.e., 470.2), his or her likelihood of passing the course would be 71.5%. The second cluster (on the right in Fig. 1), meanwhile, indicates that students who earned above the median percentage of points on instructor-graded work would have a pass rate of 88.3%. Lastly, the third cluster (Fig. 1, middle) suggests that if a student earned below the median percentage of points earned on instructor-graded work (i.e., 67.6%), but above such work’s median point total, his or her likelihood of passing would be 85.2%. Taken together, these results indicate that online high-school students should earn a certain percentage of points on instructor-graded work – or, failing that, at least aim to earn as many points as possible – to maximize their pass rates. Interestingly, neither the percentages nor the point totals earned from auto-graded coursework affected students’ pass rates.
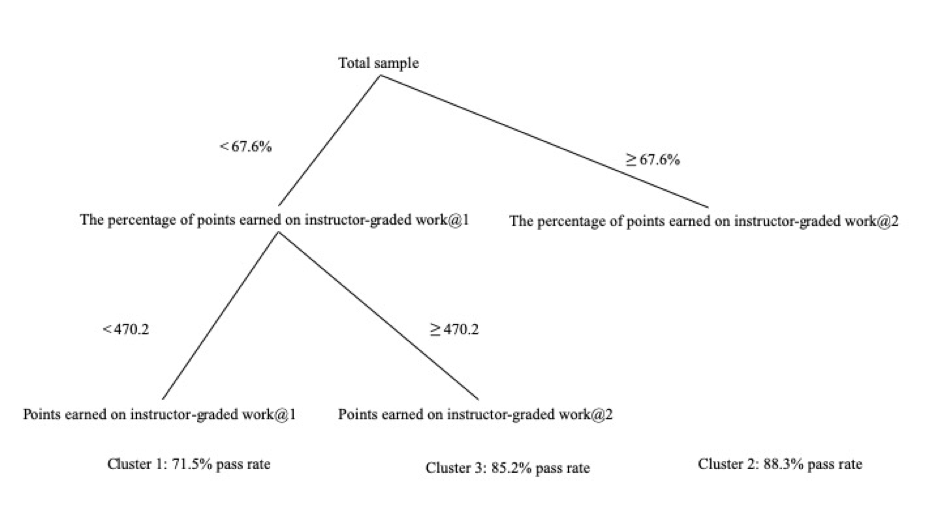
Figure 1. Decision Tree, Points Earned on Auto- and Instructor-graded CourseworkModel 8, which focused on points attempted rather than points earned, had somewhat different results from Model 7. Though both these models yielded three clusters, different variables separated them. In Model 8, the variable that separated cluster 1 from cluster 2 (on the left and right sides of Fig. 2, respectively) was the number of points attempted on instructor-graded work (Median=559). If students attempted below this median, and also earned below the median percentage of points attempted on their auto-graded work (i.e., 70.3%), their pass rate was just 71.5%; but provided that they earned above this median percentage, then their pass rate (cluster 3; 85.2%) would be very close to that of cluster 2 (i.e., 88.3%), whose members all attempted more than the median number of attempted points on their instructor-graded work.
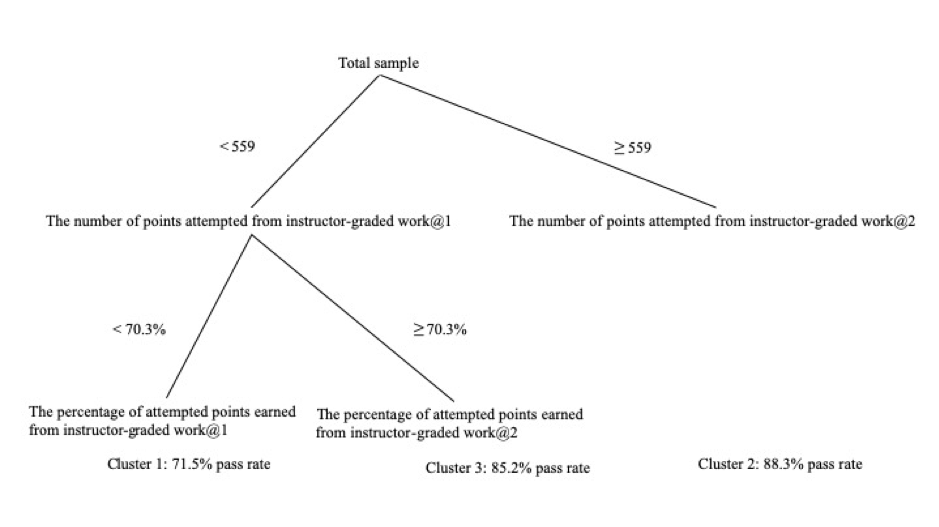
Figure 2. Decision Tree, Points Attempted on Auto- and Instructor-graded CourseworkModel 9 included all four of the significant predictors from Models 7 and 8. The results of CHAID again suggested division by two variables: in this case, percentage of points earned on instructor-graded work, and points attempted in such work. Here, however, the resulting structure was more complex, with the former variable separating Clusters 1 and 3 from Cluster 2, and the latter, Cluster 1 from Cluster 3. These results suggest that the key factor in the sampled students’ overall course performance was whether or not they received an above-median percentage of the available points on their instructor-graded coursework.
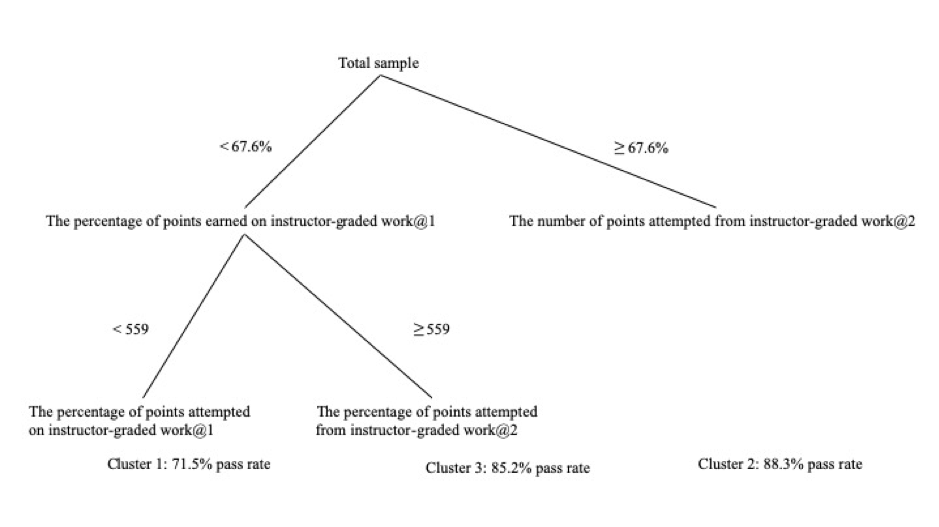
Figure 3. Decision Tree, Points Earned and Attempted on Auto- and Instructor-graded Coursework
Conclusion
This report has examined the relations of two aspects of course design to student learning outcomes. Based on 738 enrollment records from 2017-18, pertaining to 505 students, it sought to answer two questions: 1) whether the percentage of auto-graded coursework affected student performance, and 2) which variables associated with auto- and instructor-graded coursework predicted such performance.Regarding the first question, HLM indicated that the overall impact of auto-grading was non-significant. Neither the quantity nor the proportion of auto-graded work within a course predicted its students’ final scores; nor did the maximum number or percentage of points that such work represented. This conclusion, however, should not be overgeneralized, especially as auto-grading in the sampled courses accounted for as little as 5.9% and not more than 17.9% of the maximum points available. In addition, all the sampled courses were in ELA, and thus could have incorporated a higher proportion of instructor grading than equivalent courses in other subjects such as math and science. As such, it is unclear whether the influence of auto-grading on course performance would remain non-significant if such percentages were considerably higher, either in ELA and in other subjects.In the last of the three CHAID models that were constructed to answer the second research question, two variables – percentage of points earned on instructor-graded work, and points attempted on such work – split student pass rates into three clusters. Collectively, these clusters indicated that the importance of instructor grading to overall academic performance was higher than that of auto-grading. This, in turn, suggests that if online students are struggling with their overall workloads, they should concentrate their efforts on coursework that is instructor-graded. Further support for such a recommendation is provided by the fact that the same students’ performance on auto-graded work was not useful in separating them into pass-rate clusters.These results indicate several potential directions for future research. First, it would be helpful to code each piece of graded work based on Krathwohl and Anderson’s (2009) revision to Bloom’s taxonomy, and use the coding results to examine whether the quantity or proportion of instructor-graded coursework at various knowledge levels predicts learning outcomes. Second, as mentioned earlier, it remains an open question whether the present report’s findings are unique to ELA. Conducting similar studies focused on other subjects would therefore help to provide a more complete picture of auto-grading’s effects in online high-school courses. Lastly, qualitative research could help to increase our understanding of differences in learners’ decision processes and time allocation across auto- and instructor-graded coursework.
References
Kay, J., Reimann, P., Diebold, E., & Kummerfeld, B. (2013). MOOCs: So many learners, so much potential. IEEE Intelligent Systems, 28(3), 70–77.Krathwohl, D. R., & Anderson, L. W. (2009). A taxonomy for learning, teaching, and assessing: A revision of Bloom’s taxonomy of educational objectives. City?: Longman.Sherman, M., Bassil, S., Lipman, D., Tuck, N., & Martin, F. (2013). Impact of auto-grading on an introductory computing course. Journal of Computing Sciences in Colleges, 28(6), 69–75.Wang, H.-C., Chang, C.-Y., & Li, T.-Y. (2008). Assessing creative problem-solving with automated text grading. Computers & Education, 51(4), 1450–1466. https://doi.org/10.1016/j.compedu.2008.01.006Wilson, J. (2018). Universal screening with automated essay scoring: Evaluating classification accuracy in grades 3 and 4. Journal of School Psychology, 68, 19–37. https://doi.org/10.1016/j.jsp.2017.12.005
Footnotes
[1] These percentages do not sum to 100% because they were first aggregated to the section level and then to the course level.[2] A model containing the count of auto-graded pieces of work and the maximum points on such work was also created, and its results were similar to those of Model 6.