Understanding Engagement in K-12 Online Courses: Part One

Anecdotal evidence from course designers and Michigan Virtual™ instructors suggested that some students were not fully engaged with their online course materials. There was a commonly held belief by instructional staff and designers that some students were picking and choosing which assignments to do and only did the minimum required to get their desired grade. It was thought that some students were spending only as much time in the course as absolutely necessary, and even when in the course, not taking full advantage of all course materials.
There was also a belief that students were optimizing their choices; that is to say, they were choosing what they perceived as high point value, low effort activities. This “picking and choosing” approach to courses, while efficient was not trivial and had serious implications for both students and the instructional design of the courses. By skipping over material that was thoughtfully and deliberately created and placed by the instructional design team, some students were missing what is considered necessary and valuable information. And while students may perform adequately on unit assessments, by skipping course material they undoubtedly had gaps in their understanding of the course topics.
From the instructional design standpoint, considerable time and effort (both finite resources) are spent creating course materials (often called assets), time and energy that could have been diverted to other aspects of the course or other courses entirely. With these factors in mind, we wanted to better understand how online students were engaging with their courses. Beyond instructor perceptions, we did not yet have any way to answer the question of whether or not students were accessing and engaging with their online course materials. We wanted to move past perceptions and anecdotal evidence and understand the myriad ways in which students were engaging with their online courses and, based on our findings, develop strategies to improve instruction and course design and, ultimately, increase engagement. Our work is documented in a two-part blog series detailing our different data gathering and analytic approaches, our evolving understanding of engagement in K-12 courses, and implications for instructional designers and instructional staff.
To understand how students were engaging with their online courses the Michigan Virtual design team implemented three analytic approaches, Google Analytics, Hotjar, and Learning Management System (LMS) data in select courses during the 2016-17 school year. The three approaches built on one another and ultimately provided a more robust and comprehensive understanding of how students engaged with their online courses and provided the foundation to develop and pilot interventions to increase engagement. We should note here that we developed our own thresholds of “engagement” based on an expert assessment of the density (number of pages, contents of the pages) of a particular course or unit. These thresholds are explained in greater detail in the following sections.
Google Analytics
The first attempt to understand student engagement in their online courses was through the use of Google Analytics (GA) in two courses during fall 2016. GA tracking codes were added to each lesson and provided basic data about the number of visits (sessions), average duration of visit (average session duration), number of pages visited (page depth) and location (which lesson page they started/ended on).
Using GA reporting tools available through the interface, the Michigan Virtual design team randomly selected one lesson in each of the two courses to analyze in order to answer the questions:
- What was the average session duration?
- What was the average page depth?
As this data had never been collected and analyzed on a wide scale in Michigan Virtual courses, understanding average session duration and page depth would provide the team foundational understanding of how, as a group, students are interacting with the course and course assets.
The report noted 199 sessions and 1,009 page views. Given that there were 132 students enrolled in one of the two courses during fall 2016 there was an average of 1.5 sessions per student, meaning that some but likely not all students returned to the lesson more than one time. There was also an average session duration of 12 minutes and 16 seconds; given that the average student had 1.5 sessions, on average each student engaged with the lesson for 18 minutes and 24 seconds.
However when we looked beyond averages, we saw that approximately half the visits to the lesson were less than 3 minutes in duration (100/199), and of that number, 37% were less than 10 seconds, an insufficient amount of time to engage with course materials. Assuming that each of the longest sessions represented a unique student, no more than half of the students spent more than 10 minutes in the lesson. Promisingly, 34% of sessions were over 10 minutes in length; however, we cannot know if some of the longest duration sessions were simply a result of inactivity and the session being “timed out.” Overall, this does not suggest a high level of engagement with the lesson material.
Table 1. Session Duration for One Lesson
| Session Duration (in seconds) | # of Sessions | % of Total Session |
| 0-10 | 73 | 37% |
| 11-30 | 9 | 5% |
| 31-60 | 3 | 2% |
| 61-180 | 15 | 8% |
| 181-600 | 31 | 16% |
| 601-1,800 | 41 | 21% |
| 1,801+ | 27 | 14% |
This course level data informed the team’s understanding of engagement in the course lesson but left questions about how individual students progressed through the course. To understand this, the team next analyzed the behavior of individual users as they moved through the lesson pages. One technical note here: GA is not designed to provide this kind of data on the behavior of individual users; however by using custom reporting features sorted by session duration, which was unique for each visit, we were able to parse the data to measure the behavior of individual students in the lesson. This custom data allowed the team to determine the total time that students spent in a given lesson as well as the number of lesson pages that student viewed during the same visit.
In GA, we generated a custom report which sorted the data by the length of the session (session duration). See Image 1 below for a screenshot. Since the chances of two visits (counted in seconds) being exactly the same length were extremely unlikely, this allowed us to parse the data to measure the behavior of individual students. The custom report contained additional fields such as the number of non-unique pages viewed during the session, the number of unique page views, and the number of users with this exact session duration (which was often, but not always, equal to exactly one).
Image 1. Screenshot of Session Duration Sorting in Google Analytics
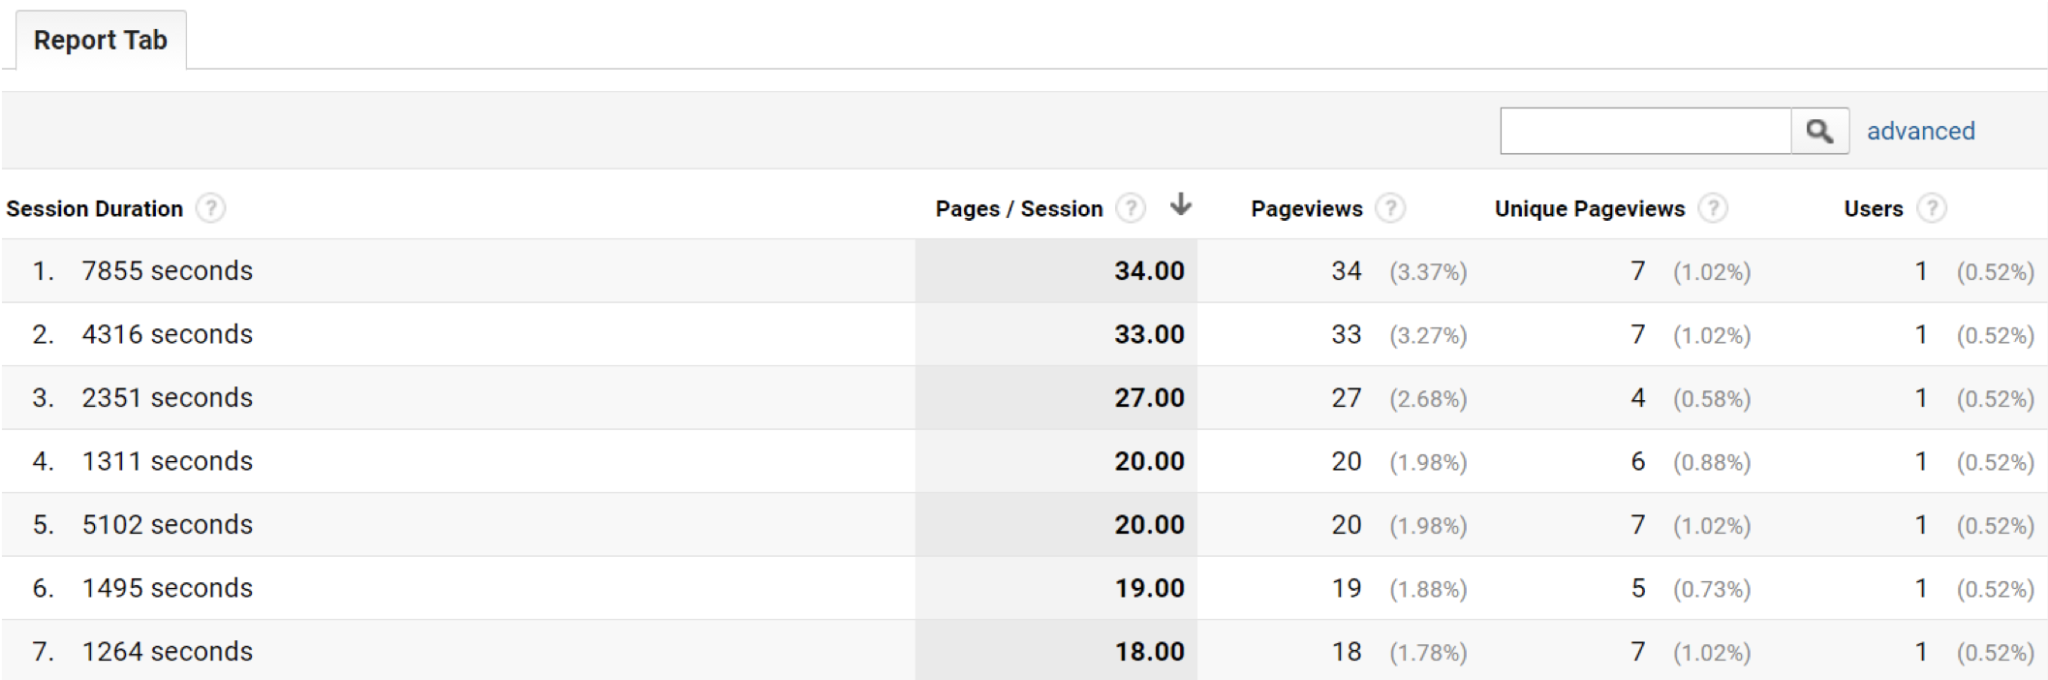
With this data in hand, we then had to determine what constituted an “engaged session.” If, for example, a student viewed the lesson for 15 minutes, but only viewed two unique pages (out of seven possible pages in the lesson), had that student fully engaged with the content? Likewise, if a student viewed all seven pages of a lesson, but the session only lasts 30 seconds, it was unlikely that they sufficiently engaged with the content. While a cut-off point for an “engaged” vs “unengaged” lesson is somewhat arbitrary, we used natural breaks in the distribution of session duration and session depth. For example, the table below illustrates the distribution of session depth for a particular lesson.
Table 2. Count of Sessions by Page Depth Item for One Lesson
| Session Depth (in Pages) | # of Sessions | % of Total Session |
| 1 | 55 | 28% |
| 2 | 31 | 16% |
| 3 | 16 | 8% |
| 4 | 19 | 9% |
| 5 | 34 | 17% |
| 6 | 26 | 13% |
| 7 | 18 | 9% |
Ultimately, the course designers — experts in the course content — determined that appropriate criteria for an engaged session would be viewing at least half of the lesson pages and spending at least four minutes in the lesson. Using these criteria, we counted the number of engaged sessions in each lesson of the courses we monitored. Sample data is provided below for one of the courses.
Figure 2. Count of Engaged Sessions by Lesson Item
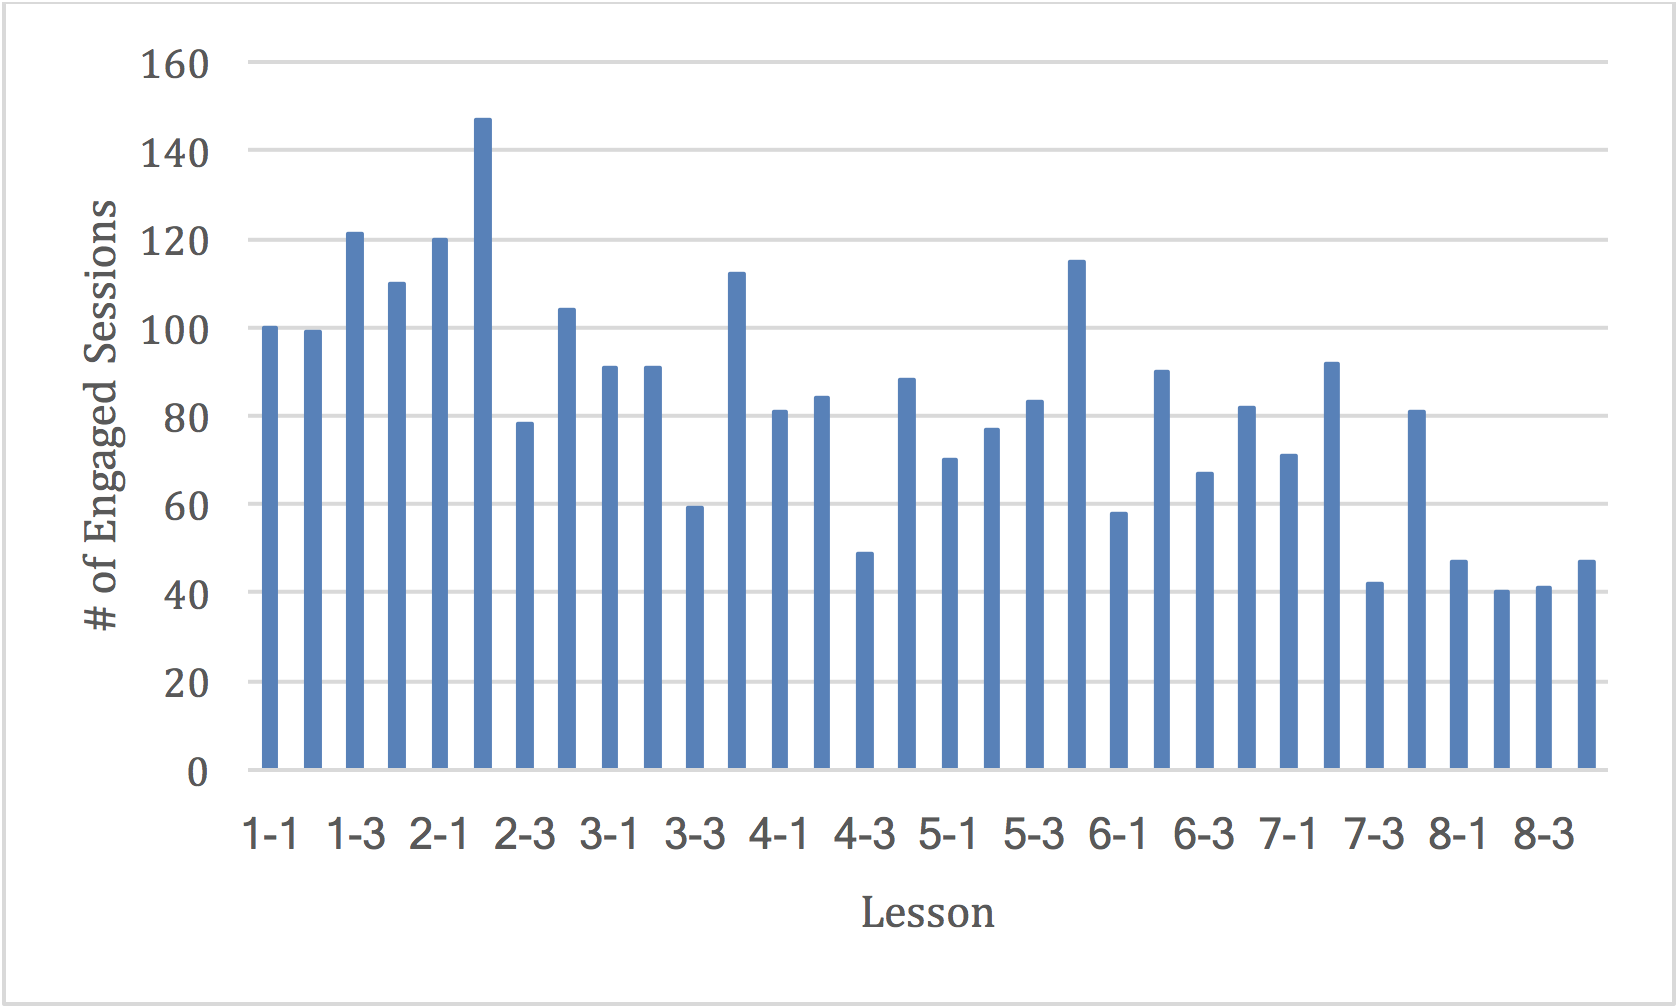
Parsing the data this way illustrated that there was clear variation in student engagement from lesson to lesson, as well as a general trend toward lower engagement as students progress through the course. The data also revealed that some lessons represented “hot spots” for student engagement while others represent “cool spots.” That is to say, there were particular lessons in the course that had seemingly higher engagement overall and some lessons with lower engagement overall.
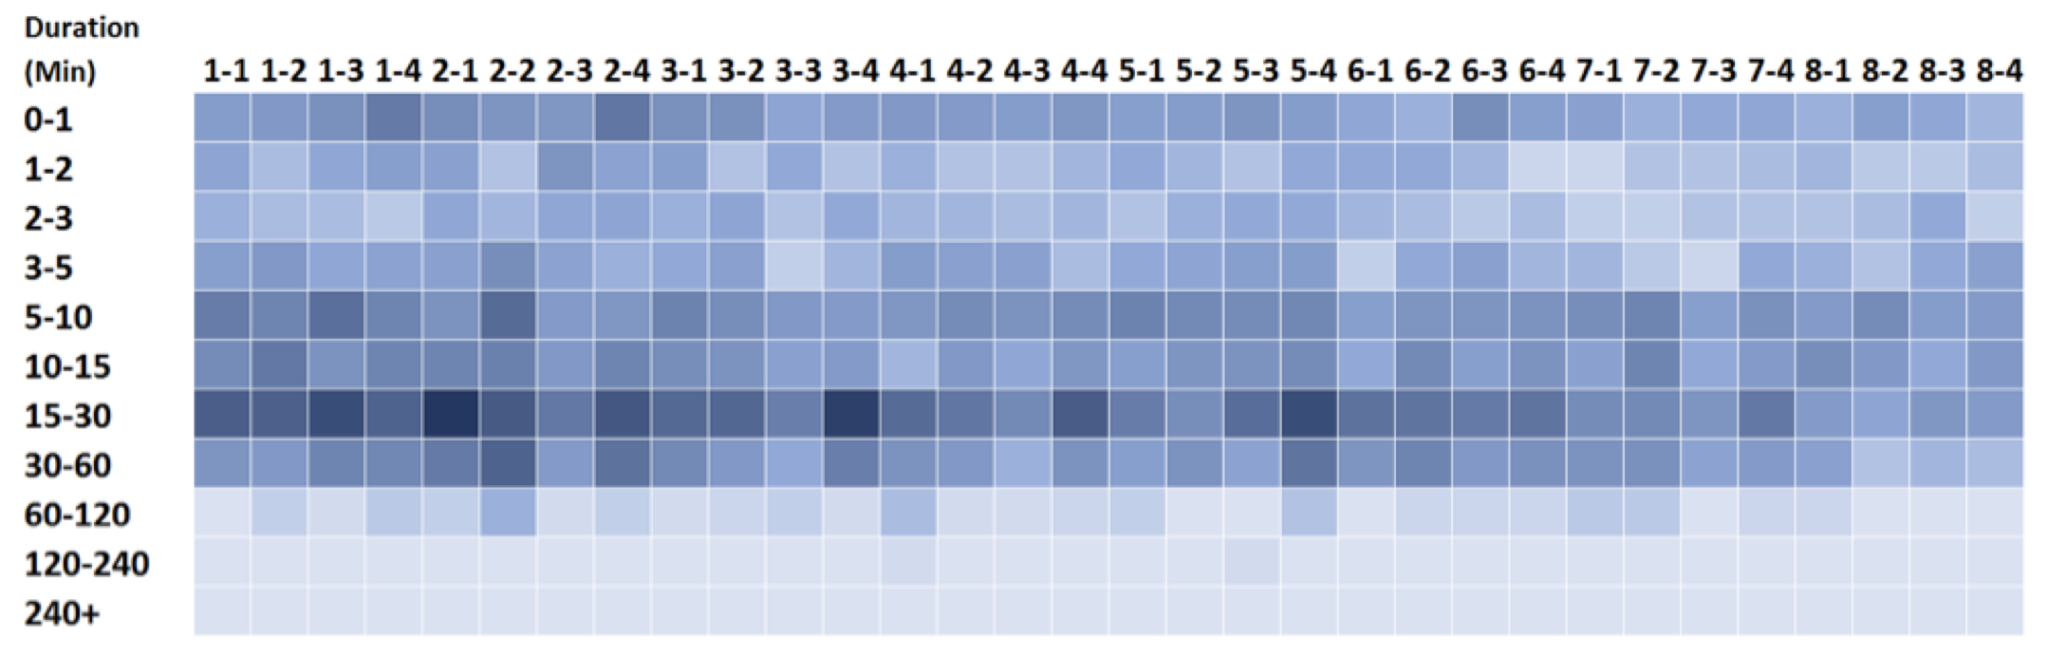
Given our findings of engagement lesson-by-lesson, we wanted to identify a better method for visualizing hot and cold spots of student engagement within a course. Using color intensity to represent the number of students, with dark blue denoting more students and light blue fewer students, we produced the heat maps for page depth and session duration, show below. For both maps, as you move downward vertically in the chart, you move toward greater engagement. As you move horizontally to the right, you move to later lessons in the course.
Figure 3. Heat Map of Page Depth Engagement by Lesson
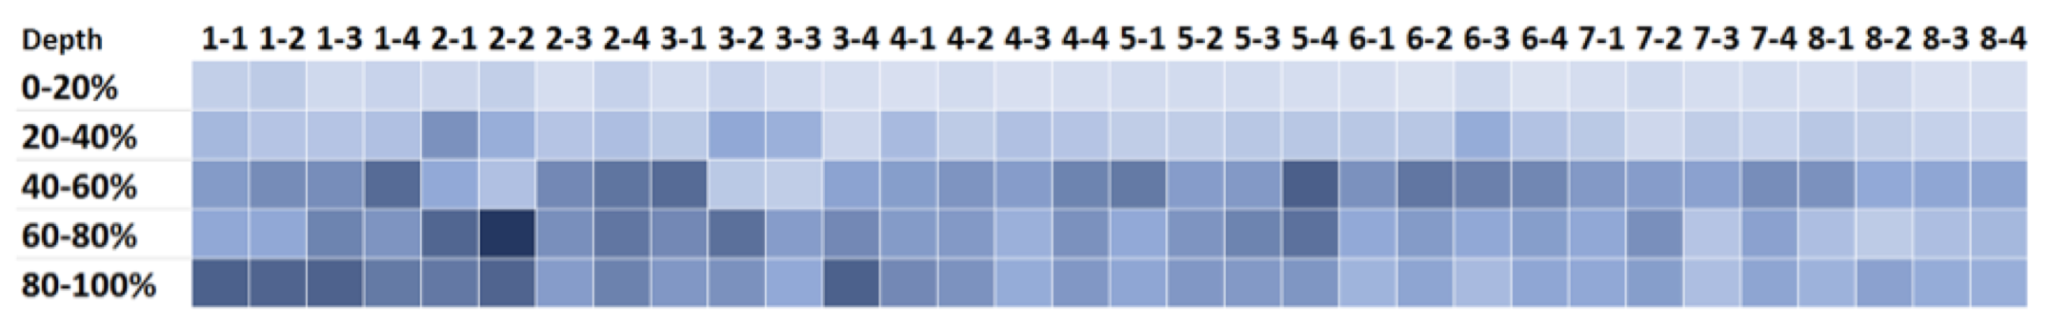
Figure 4. Heat Map of Session Duration Engagement by Lesson
While these maps illustrate engagement in greater detail, we found that the detail came at the cost of functional usefulness. Both the high engagement and low engagement lessons presented opportunities for course designers to investigate the specific lessons and understand better why it may be a high or low engagement lesson. Should these trends persist for multiple semesters, there is also an opportunity for course instructors to implement simple interventions to increase engagement in historically low engagement lessons. We struggled, however, to move past the novelty of the maps and were unable to identify more clear and focused improvement goals beyond further investigating and potentially improving certain lessons. We next turned our attention to understanding not just how long students spent in the course and how many pages they viewed, but what they did while they were in the lesson.
Hotjar
During the research time period, we learned of a new user-tracking tool called Hotjar. When embedded in a web page, Hotjar anonymously tracks user (in our case student) activity on a specific page including cursor motion, scrolling, clicking, and timestamps. The data is used to record screen capture videos of the users’ activity on the page and produce aggregated heat maps of user behavior (specifically where users tend to click on the page most frequently).
Hotjar requires a tracking code be inserted into the <head> tag of the lesson HTML pages. For this reason, the tool could only be used on lessons that were published to our local media server (as opposed to the cloud-based services we normally use for lesson hosting). Much like GA, Hotjar cannot track students as they move from one domain to another (say from Blackboard to our lesson pages); but unlike GA, Hotjar is designed to track individual students to understand their behavior while in the lesson pages.
We selected two lessons — one from each of our monitored courses — to be hosted on our media server with embedded Hotjar tracking codes. The result was a collection of screen recordings that showed the behavior of individual students as they moved through these lessons. See Image 2 below for a screenshot. In one semester, we captured hundreds of these recordings, ranging from a few seconds to over an hour. The recordings move beyond the basic data of page views and session duration captured by GA (although Hotjar captures that data as well) and gives an intimate perspective on how students navigate through the lesson content.
Image 2. Screenshot of Hotjar Recording
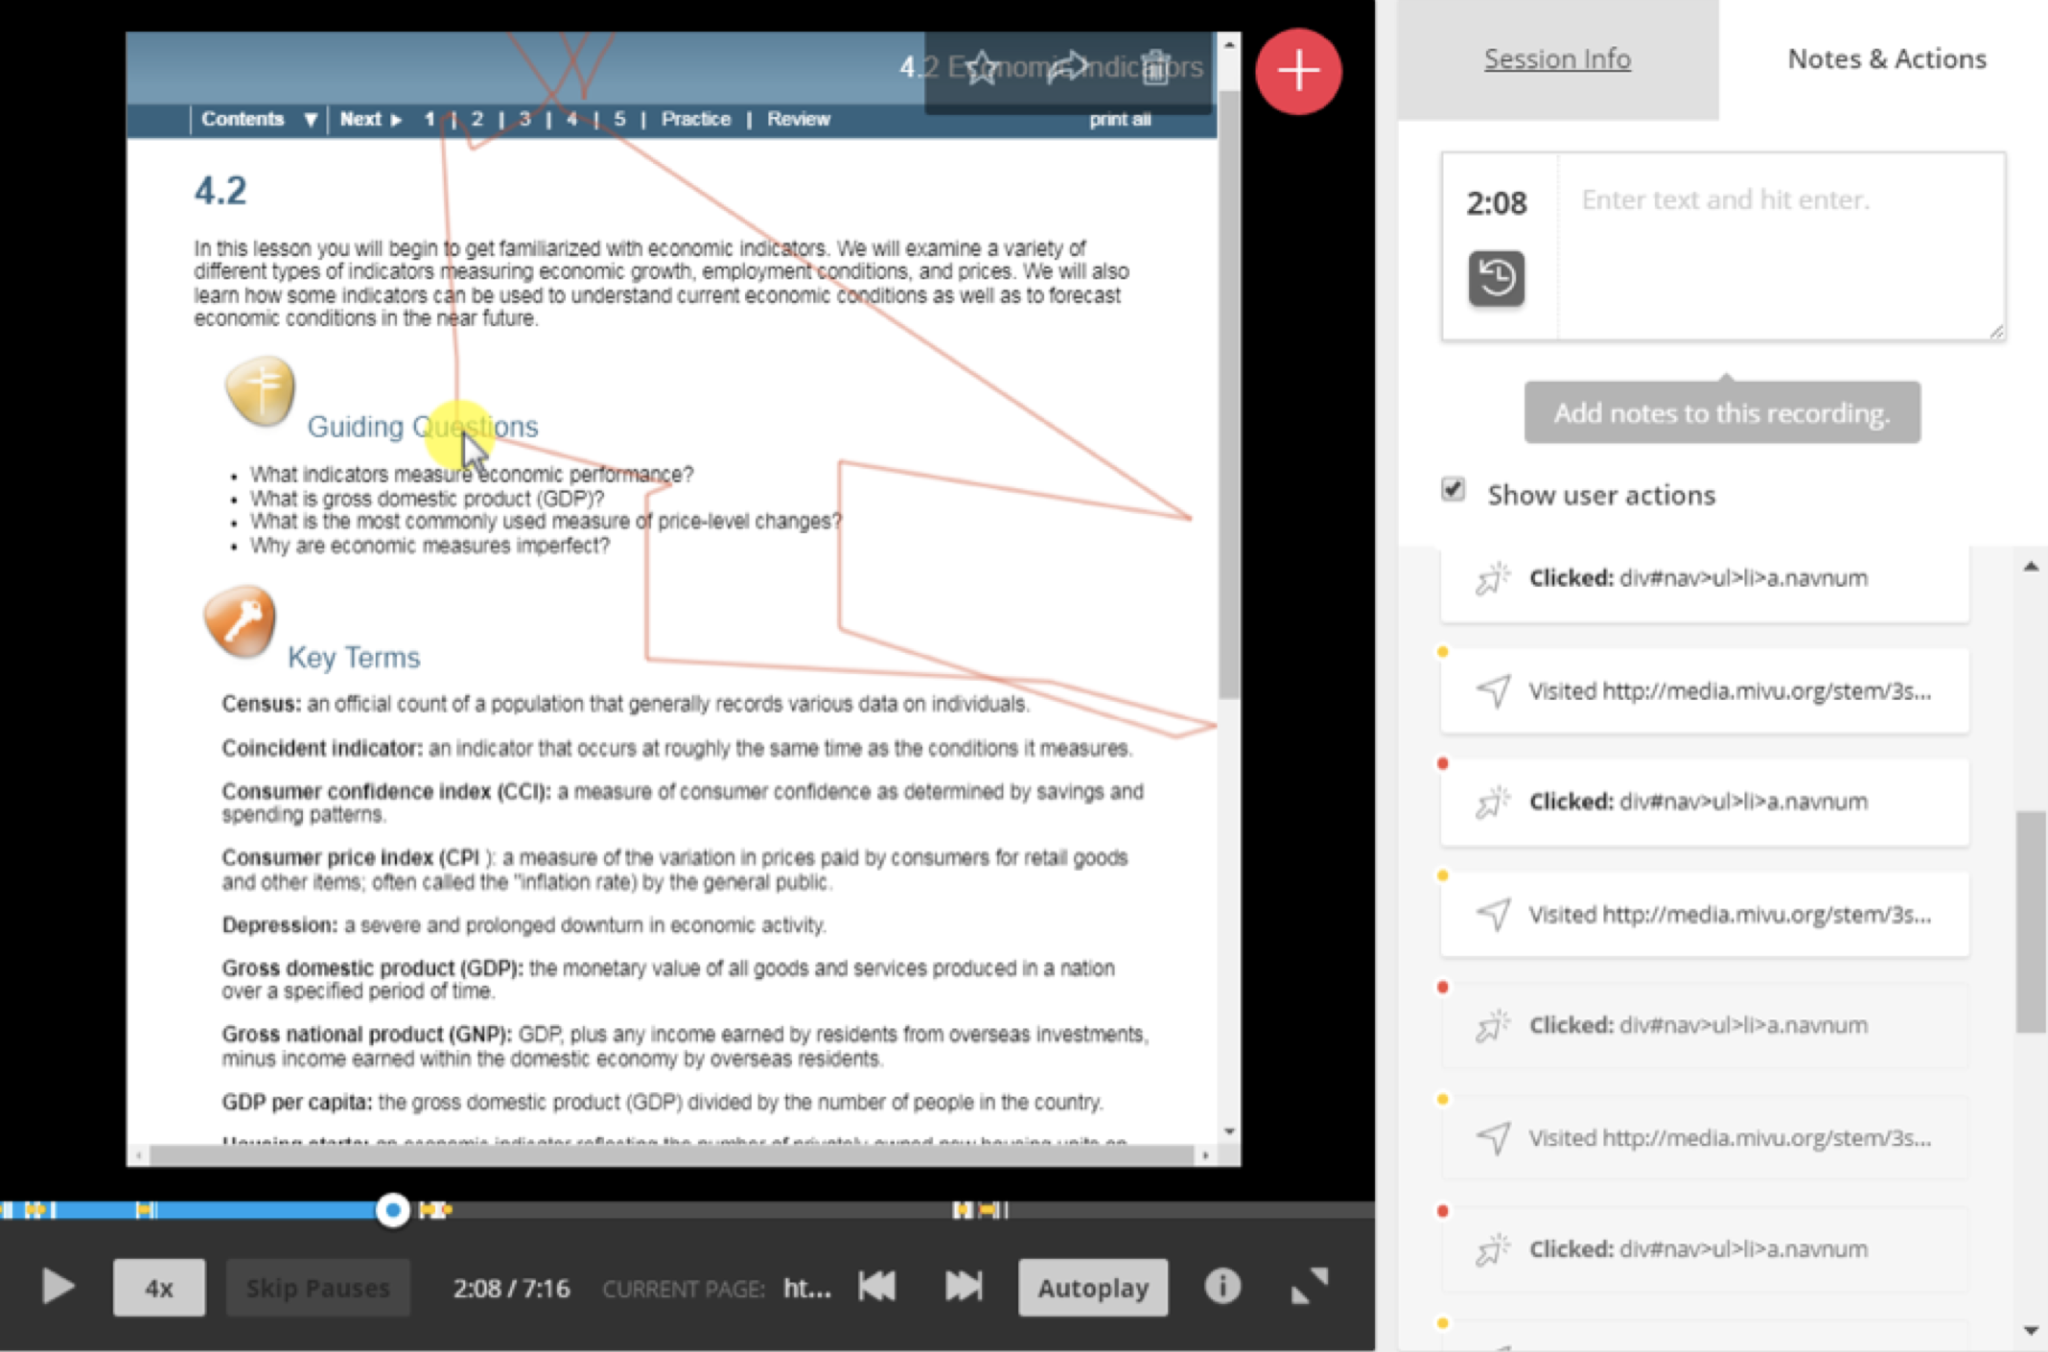
Hotjar recordings play like a fast-forwarded movie, showing the motion of the user’s cursor and highlighting specific actions such as page clicks and scrolls.
The individual screen recordings are overwhelmingly detailed and difficult to aggregate into useful information. However, Hotjar also provides a “heat map” feature which presents the hot spots within a lesson page where students are clicking the most frequently. See Image 4 below.
Image 3. Screenshot of Hotjar Lesson Hotspots
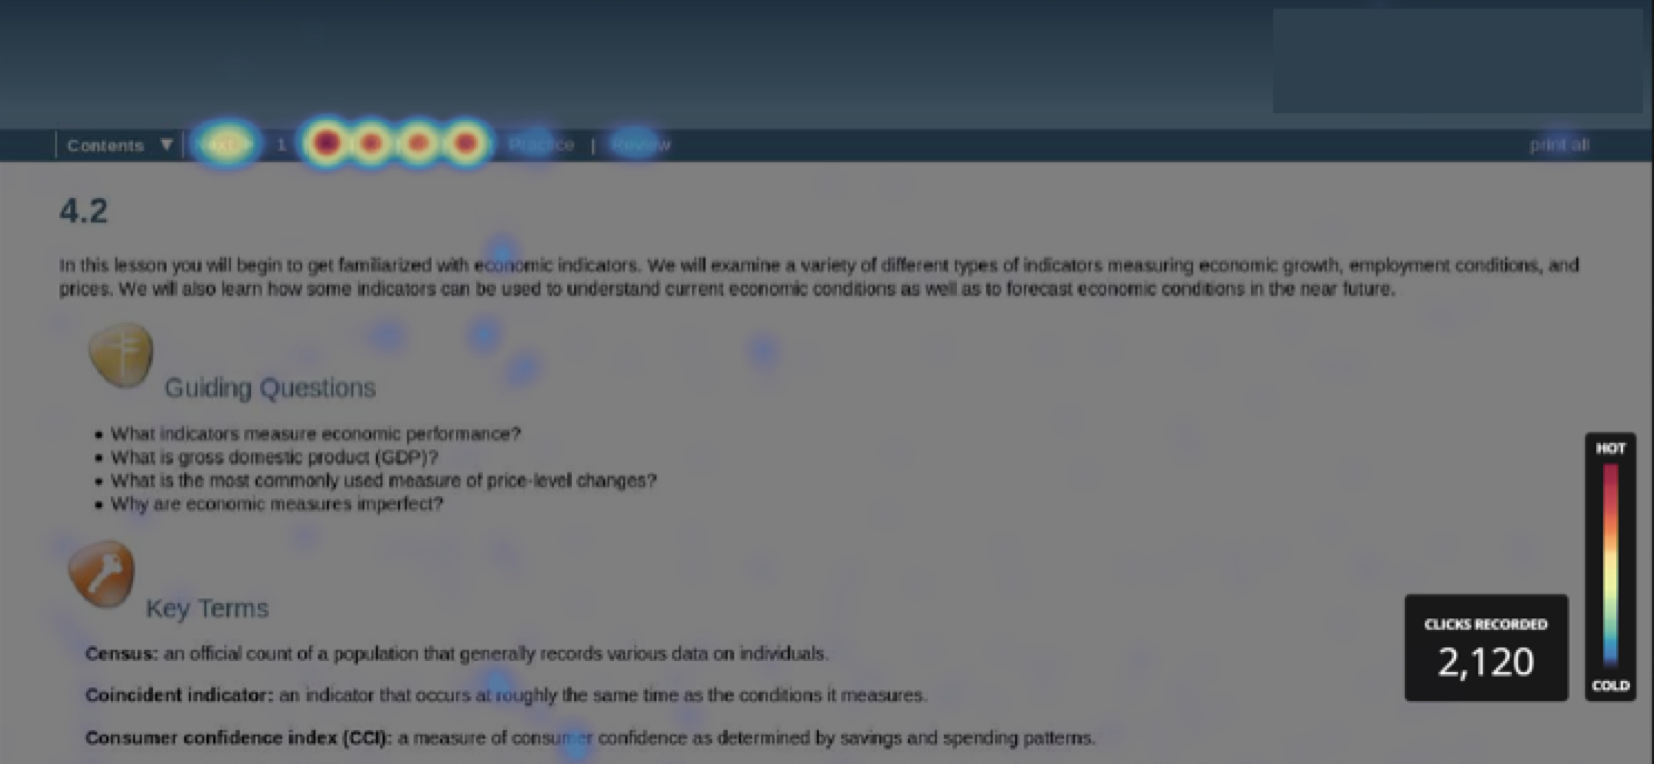
The heat map data in particular lead to an unexpected discovery: A small (but non-zero) percentage of students were clicking on the “Print All” link on the lesson homepage. This suggests that some students were printing their online lessons and reading them from paper. While this may not seem problematic, many of the lessons included interactive elements which clearly would not work when printed. Moreover, it was simply a shock to our instructional design staff that anyone would be interacting with our content on paper rather than a computer.
Among our team, this “print all” discovery was the most meaningful realization to date from the Hotjar data, and we have begun disabling the feature in courses that rely on many interactive features.
Michigan Virtual Learning Research Institute
The Michigan Virtual Learning Research Institute (MVLRI) is a non-biased organization that exists to expand Michigan’s ability to support new learning models, engage in active research to inform new policies in online and blended learning, and strengthen the state’s infrastructures for sharing best practices. MVLRI works with all online learning environments to develop the best practices for the industry as a whole.
Related Posts

Understanding How Students and Teachers Think About Responsible AI Use: An Interview with a Researcher
Students and teachers generally understand the risks of AI misuse, but they are less clear about what responsible AI-supported learning should look like in practice. This interview highlights findings from a Michigan Virtual study showing that students need clearer examples, consistent expectations, and practical guidance for using AI transparently and appropriately in schoolwork.

What Happens to Students' Online Course Scores After the Course Ends?
The moment an online course ends, a new question begins: how will that score be recorded locally? Drawing on a 2025 brief and a small follow-up survey, this blog post outlines three common approaches districts use to interpret and record students’ online course scores and why the differences can matter for students.

Out of Order, Still Out of Reach: Variations in Pacing among World Language Students
Cuccolo & Green’s (2025) report highlighted the relationship between students’ assignment submission patterns and final course scores. Given that pacing has important implications for student performance, knowing what assignment submission patterns look like across schools with varying demographics could help prompt early identification and intervention. As such, this blog explores students’ assignment submission patterns based on school-level demographic information.

From Curiosity to Career: Exploring Possibilities with VR
Explore how immersive VR simulations helped students step into real-world roles: from EMTs to chefs, all without leaving the classroom.

Out of Order, Still Out of Reach: An Interview with a Researcher
In this blog, MVLRI researchers synthesize the key findings from two research studies about student assignment submission patterns in Michigan Virtual online courses.

Understanding Teacher-Student Communication in Online Courses: An Interview with a Researcher
In this interview, MVLRI researchers discuss key findings from a report highlighting how personalized, consistent, and timely communication in online courses can help students feel more connected to their online teachers and may also impact their success in the course. This blog also explores practical strategies for communicating effectively and building relationships with online students.