
How do online schools and curriculum providers attend to the myriad needs of teachers, students, and staff? This constant juggling act requires skill, tact, and most of all, data.
To cite one example, Scout from the University of California is busy determining the ideal length of our registration window. Scout students come from different middle and high schools across the country, and not every school starts their courses when we start ours. A prospective Scout student might hear that a class they want at their school is full and only learn about Scout a week or two into our semester. We want to be able to offer courses to those students.
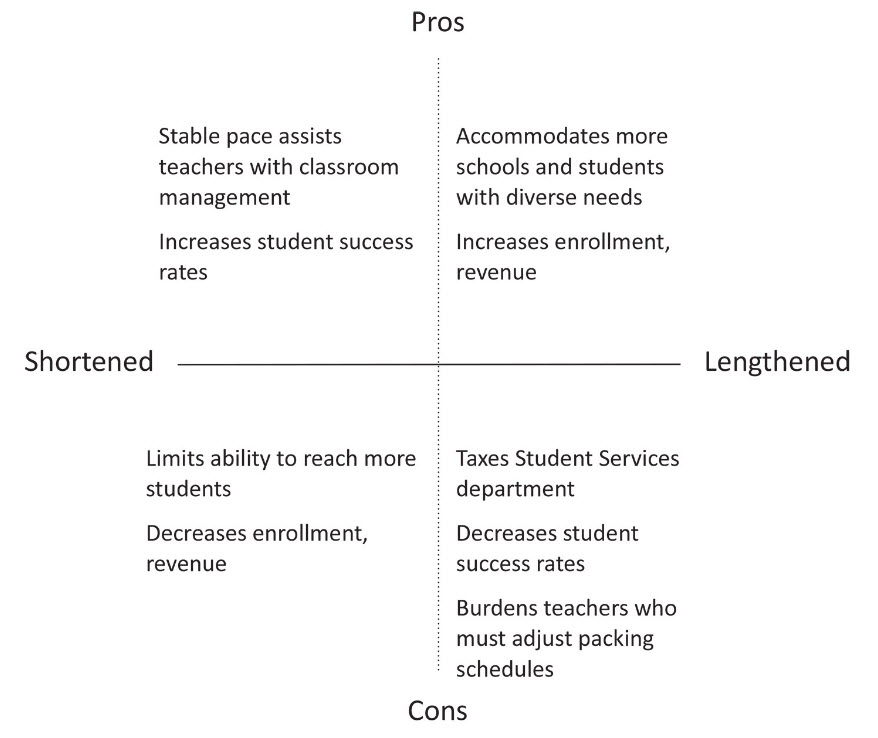
Last fall students could register up to four weeks late — lenient perhaps; but again, one of our top priorities is to accommodate as many students from as many schools as possible. Shortening or lengthening the window has implications both within and beyond the organization, as illustrated below:
Several claims appear within this graphic. Perhaps least striking is the alleged relationship between student success and time of registration. For many teachers, this is axiomatic: less class time = less chance of success. But the data may or may not support this assumption. And as the registration window discussion at Scout chugged along, we set out to see if there was a connection. The contingency table below shows the intersection of characteristics between two categorical variables: Letter Grade and Time of Registration. It’s admittedly a small sample size, but we’ve culled the data from our past three semesters to produce this table. We’re checking to see if the probability that a student receives Grade ‘X’ (the outcome variable), given their time of registration, matches the marginal distribution on the right side of the table1. We could rewrite the statement thus:
The contingency table below shows the intersection of characteristics between two categorical variables: Letter Grade and Time of Registration. It’s admittedly a small sample size, but we’ve culled the data from our past three semesters to produce this table. We’re checking to see if the probability that a student receives Grade ‘X’ (the outcome variable), given their time of registration, matches the marginal distribution on the right side of the table1. We could rewrite the statement thus:
P (Student Receives Grade ‘X’ | Time of Registration) = P (Marginal Distribution)
If this statement is true, there is no relationship: a student’s chance of success is independent of their time of registration. But if the statement is false, a possible dependency exists.
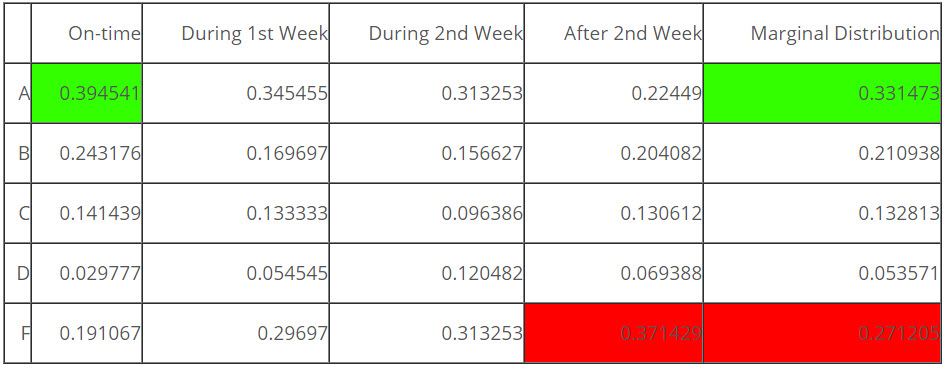
The contingency table is revealing. The probability that a student who registers on time receives an ‘A,’ for example, is almost 40%. Compared to the overall marginal distribution of 33%, that 7% jump represents a significant increase (highlighted in green). Conversely, the probability that a student who registers over two weeks late receives an ‘F’ is 37%, up from the marginal distribution of 27% (highlighted in red). The ‘A’ and ‘B’ rows trend noticeably downwards during the registration period while the ‘D’ and ‘F’ rows trend upward. The trends are displayed graphically below, where the dotted lines show the marginal distribution for all students who received an “A” or “F”:
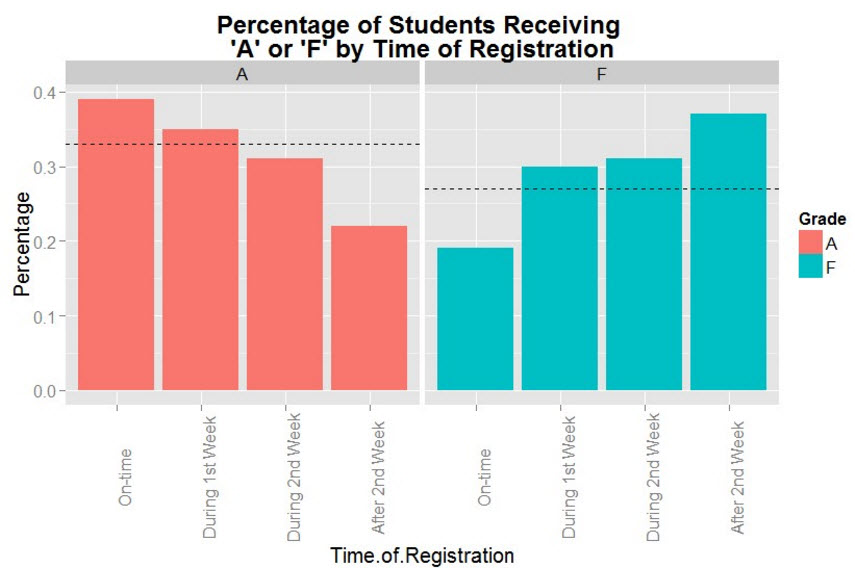
Again, two striking observations come into view. First, the ‘A’ and ‘F’ bars flip-flop during the registration period; the probability that a student receives an ‘A’ drops 17 points, and the probability that a student receives an ‘F’ jumps 18 points. Second, the probability that a student receives an ‘A’ or an ‘F’ during the second week of registration is identical. At Scout, this was a welcome revelation, as we had recently decided to close the registration window at precisely this point. Our instincts appear to be correct!
But there are still other issues to consider. A student who registers on time is indeed more likely to earn a higher grade than a student who registered three or even four weeks late, but that late-registering student is by no means doomed to failure. About 58% of students who registered over two weeks late managed to pass their course, 45% of whom received an ‘A’ or a ‘B.’ Is it fair to deny these opportunities to enterprising students? Perhaps not. Although the late students’ success rates lack enough strength to inspire a shift in policy at present, it’s not weak enough to ignore. If a student who registered two weeks late were granted a two-week extension, we predict they would perform equally well or at least closer to the marginal distribution. The problem for Scout and the students is compressing the course material into a smaller amount of time. This has pushed us to consider less restrictive, self-paced options. We don’t have much data on this but suspect that the students who start late share the same characteristics of the students who start on time and that late registration is usually due to scheduling quirks at the students’ school and not a certain characteristic of the student. But this is something else to explore!
The questions only continue: what are the appropriate ratios of student success? And because the time of registration affects these ratios, when should the registration window close? Are there qualitative differences between students who register on time and students who register late? Is the solution, perhaps, to embrace less restrictive, self-paced courses? Clearly, we need more data. The opportunity to compare these numbers to another online school would be a welcome development.
Our struggle to pinpoint the ideal registration window has sharpened our institutional thinking and can be viewed as a microcosm of the challenges that face online schools and curriculum providers alike. Striking the right balance between service and subsistence, and pedagogical quality and institutional integrity remains a tricky affair. Especially without data.
About Scout
Learning is synonymous with empowerment at Scout. We are teachers, instructional designers, and technologists working to deliver University of California-quality interactive online classes, curriculum, and supplemental education materials to middle school and high school students and teachers across the US and beyond. Our course materials are designed to inspire life-long curiosity and prepare pupils of all backgrounds and education levels for an increasingly technological world where training and job skills are mobile, asynchronous, and self-directed. Explicitly created to bridge achievement gaps, we believe that using technology effectively can remove traditional obstacles to education.
Blog Author
David Ranzolin, Scout Analyst
Scout from University of California
[email protected]
1The Marginal Distributions show us the percentage of all students that received Grade ‘X,’ regardless of time of registration. For example, 33% of Scout students received an ‘A’, 21% of Scout students received a ‘B’, etc.
