
In the second part of this two-part blog series (part one can be viewed here), we continue sharing the action research carried out by Michigan Virtual teachers as part of their involvement in the teacher professional learning community.
Kevin Santer
AP Computer Science A, Semester 2
This course is the second semester of a two-semester sequence and is aligned to the Advanced Placement curriculum for Computer Science A. AP Computer Science is a college level computer course covering the applications of computing within the context of programming methodology, algorithms, and data structures.
The Problem
The exam scores in AP Computer Science A, semester 2 are nearly 20% lower than the rest of the assignments (75.9% average score compared to 95.3%). While the first semester course was not targeted in this study, the discrepancy between exam and non-exam scores is very similar.
The Change Idea
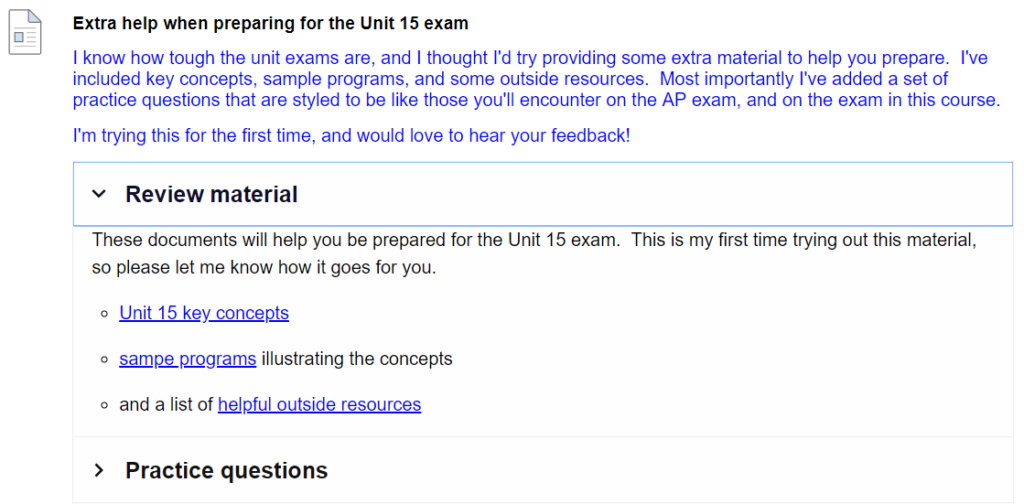
For each unit exam, design and incorporate a summary of key concepts and a set of review questions that highlight material tested on the unit exam. The questions were styled like those on the AP exam and have a similar level of difficulty. For this project, I chose to try the approach for the Unit 15 exam first, as students were nearing that assessment at the time. Using an H5P object to incorporate the material into the Blackboard module, I added two forms of supplemental resources:
- a set of review material – a key concepts list, sample programs illustrating the concepts, and a list of outside resources
- a set of multiple choice practice questions with explanations for the correct answers
The results
I calculated summary statistics, made some charts, and ran a few statistical tests. It was a little challenging to find data for comparison. I haven’t taught the course before, so I didn’t have my own historical data to compare. I ended up comparing this semester’s results across all sections – the section taught by me and five sections taught by other instructors. This introduces some variables, especially in the teacher graded portion of the exam, so I chose to only analyze the auto-graded (i.e. multiple choice) portion.
*these values correspond to test scores of 82% and 72%
| 1 Section (Taught by Me) | 5 Sections (Taught by Others) | Difference | |
|---|---|---|---|
| N Test Scores | 14 | 82 | N/A |
| Mean | *16.4 | *14.4 | 2.0 |
| StDev | 3.2 | 3.8 | -0.6 |
| Median | 16.0 | 14.0 | 2.0 |
Statistical tests
I checked my data, indicating the variance to data was equal. With that result I attempted to test if the two groups are statistically different using a t-test. A two-tailed t-test where the null hypothesis is Ho: mean (sections 2-6) = mean(section 1) results in p = 0.0136.
This result does not, however, provide empirical evidence of a difference between the two groups as there are some statistical validity threats, including the data was not examined in terms of other assumptions besides equal variance and the factor of unbalanced sampling.
Most importantly, this is not a research-designed test. The intent was to identify a concern, hypothesize as to its cause, and to implement an intervention. It was not designed to support formal statistical evaluation.
The Results
While there are a number of reasons to be careful when considering these results, the overall result was positive. It seems reasonable to invest the time to create similar supplemental materials for all unit exams in both semesters of the course. It would help subsequent analysis if tracking was turned on for the resources in order to see how many students are using them. A more detailed analysis of which questions students are answering incorrectly would help guide the development of the resources.
A short student survey might also shed light on obstacles and issues.
On a larger scale, this indicates an opportunity for collaboration between researchers and practitioners to expand upon the approach, designing more formal experiments with the same overall goal of improving students’ learning experiences.
Heather Murphy
American Literature B, English 11-12
This is the second course in a two-course sequence and has been redesigned to align to the Common Core Standards. Two major themes for this semester are “Becoming My Own Leader” and “Leading Others.” Students will address several essential questions related to these themes while reading a variety of works by American authors. In addition to major works, students will read short stories and informational texts, engage in poetry analysis, view informational videos, and write for various purposes. Larger writing assignments include an argument essay, a narrative essay, and a business email.
The Problem
Teaching is full of meme worthy moments. Some make you laugh out loud when you see them; some make you cringe because you have been there. How many times have you thought, “This is a great lesson, the kids are going to love it!”, only to reach the end and wonder what went wrong? As teachers, we have all experienced success and failure as we create and present lessons. Sometimes it seems obvious what went wrong; other times, we are left scratching our heads.
Sometimes the reason for failure was glaringly obvious – maybe the students didn’t have the prior knowledge that I assumed; maybe the tools and/or technology that I was trying to integrate didn’t work or was too complicated; or maybe the kids just couldn’t relate to the topic the same way that I, as an adult, did. Other times, I was a little more stumped when trying to figure out what went wrong.
As teachers, we often try to analyze things from the lens of the classroom and sometimes forget to regularly gather empirical data to analyze our methods and results. With the demands of teaching and our desire to give our students the best possible experience, we often feel that we don’t have time to make our observations more “official.” The experiential data that we gather can help us tweak and improve our lessons; however, testing these theories is important and allows us to focus on the actual data rather than our “gut feelings” or personal opinions. This is not to say that those feelings and opinions lack value, as years of teaching experience and student interactions are a valuable part of any teacher’s skill set. As I set out to analyze one of the assignments in my English 12B course that had historically low submission rates, I struggled to balance those “gut feelings” and data. Let me share my journey with you.
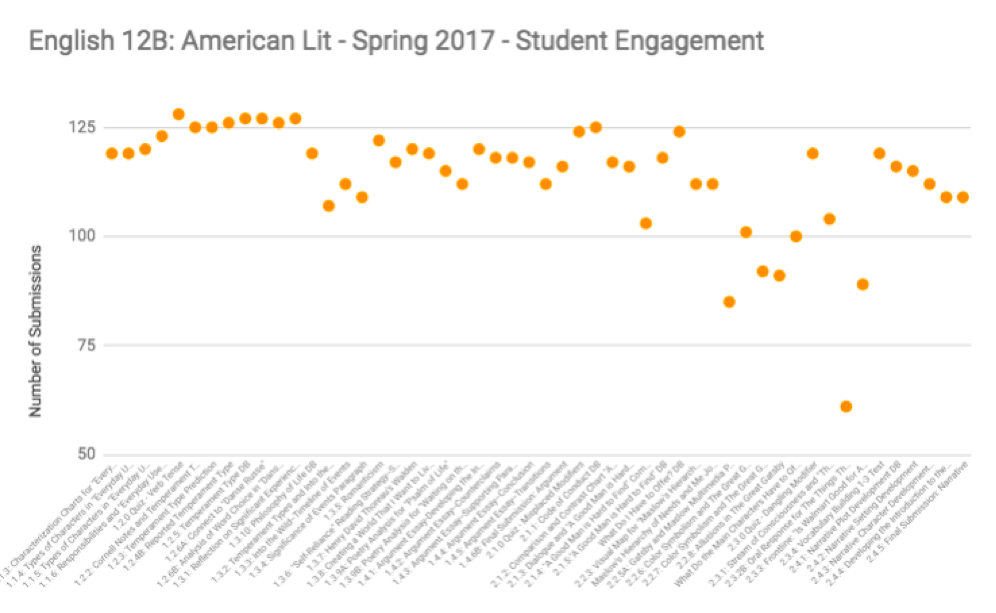
The problem that I identified was that only 46% of students were submitting one of the assignments in American Literature B, English 11-12. The assignment in question, 2.3.2B: Oral Response for The Things They Carried, is a speech assignment that requires the students to write a letter based on readings from The Things They Carried, by Tim O’Brien, and then record themselves reading/presenting their work. This assignment addresses Common Core English Standards for Speaking.
My initial thoughts were that there could be numerous issues causing this lack of engagement: students do not like speeches or recording themselves and/or technology barriers; this assignment occurs toward the end of the course; it is only worth 10 points when other assignments that require similar amounts of student effort are worth double that. I won’t lie: my brain was screaming that the issue was the combination of student dislike of speeches and the low point value. I was, and still am, one of those students – I hate speaking in front of my peers and am often tempted to play the “point game;” if it’s not going to hurt my grade that much, it might be worth skipping! However, changing the base assignment or anything grade book related were outside the parameters of our study, so I decided to focus on technology barriers. I figured, even if I don’t think this is the real issue, I could be wrong and adding more resources never hurts, right? I dug in with gusto!
The Change Idea
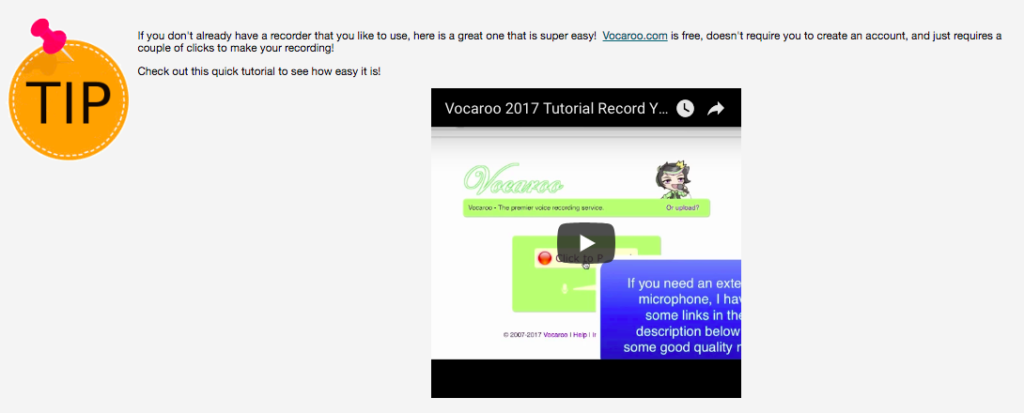
Add supplemental materials to guide students to appropriate tools to use for recordings. Provide numerous options that will allow students to use a variety of devices to create a recording. I added videos and different resources for recording and submitting voice recordings. The options included recorders that required a computer with a microphone, cell phone apps, and even recorders that would allow you to call from any phone and record your response.
I embedded a video of the resource that required the least amount of steps directly into the assignment and provided a link to a Google Slides presentation that outlined several other options. As the students began to approach the speech assignment, I also shared the slideshow of recording options in my announcements several times and encouraged students to find the one that worked for them and to contact me if they needed help.
The Results
Then I waited to see what would happen. I did receive a couple of messages from students letting me know that they really liked Vocaroo.com, the tool that I had shared directly in the assignment. However, my results were disappointing. At the end of the semester, only 44% of my students had submitted the assignment and only 27% had earned credit. A handful of students did not appear to understand the base assignment and submitted something that did not fit the requirements, a couple submitted files I could not open and did not resubmit, and 25 out of the 44 students enrolled made no attempt to submit the assignment. Compared to the historical submission rate of 46%, I actually had worse results with 44% of students submitting.
Did my resources make the assignment look more intimidating? I’m not sure. In the grand scheme of things, 2% isn’t a huge difference one way or the other. Does this mean that this experience was a failure? No, I don’t think so at all. One of the possible causes of the low student engagement has been eliminated from the list, and I gathered some great resources that I can still share with students across all of my courses. Could the problem really be that students just avoid speeches like the plague? At this point, we still don’t know the data-driven answer to that question, but we have a start at moving in the right direction. There are still many possibilities to explore – changing the point value of the assignment, moving it closer to the beginning or middle of the course, or just giving students more practice with speeches to make them more comfortable could all be solutions; or there could be a solution that I have not considered. No matter what the solution, this experience taught me many things about the importance of using empirical data to help guide my decisions in the classroom. As I teach my students, failure is not a bad thing; failure is an opportunity to learn and find a new direction toward your goals.
Holly Boleski
Oceanography A
This is the first course in a two-course sequence that provides an excellent opportunity for students to gain knowledge about the physical and chemical structures of both salt and freshwater ecosystems. This course is interdisciplinary by way of explorations of various topics and provides an assortment of hands-on labs and video field trips. Oceanography encourages students to evaluate the appropriate kinds of research that are related to both natural and environmental issues.
I Got 99 Problems and the Unit 8 Project is One
The Unit 8 Project within Oceanography A is the least completed assignment in the course. According to recent Course Engagement Data, only 55.8% of students submit this assignment. This low submission rate is likely due to the type of assignment, the complexity of the assignment’s instructions, and/or the assignment’s location in the course.
First, this assignment is an audio/visual presentation where students create a slide deck scientifically comparing and contrasting salt-water species of their choosing and then record their screen to present their information verbally. These types of project-based, student-centered assignments usually require a high-level of student buy in and tend to be completed less than computer graded tests or quizzes. To help make this point, the Unit 8 Test (the last assignment in the course) had an 83.5% completion rate according to the same Course Engagement Data.
The second reason I believe this assignment may have a low submission rate is due to the assignment instructions themselves being a bit cumbersome. This assignment requires very specific scientific information to be included, and accurate, on each slide.
Lastly, this is the second to last assignment available to students in their course, right before the Unit 8 Test; only those that complete nearly all of the course’s assignments, the previous seven Unit Projects at a minimum, would have the Unit 8 Project available to them to complete. Like all other Unit Projects (8 in total), this project is worth 30 points, or ~5% of the course’s total points (607).
Because the assignment is time consuming to put together, requires some thought in following instruction, and is the second to last assignment in the course, I can see it would be easy for students to simply not complete it.
The Change Idea
In most circumstances, I do not like to provide students with examples for what their finished product may look like. I believe doing so may stifle creativity and lessen my chances for seeing the brilliance of my students’ minds. In this case, however, my idea to resolve the low submission rate involved creating a teacher example video to clarify instructions and allow students to mimic format. My idea was that in creating a teacher example video, students would spend less time figuring out how the project would look so that they could focus on what the project would say. As I am really only interested in scoring the content of their project, it seemed less important to focus on creativity, especially with time being such an important factor in this matter.
I also thought a video would help clarify some of the more elaborate instructions involved with this assignment, and students could easily see in the video how I met the assignment’s objectives. The next steps were to complete the project according to the assignment’s instructions, post the teacher example video on YouTube, and amend the assignment instructions to direct students to watch the example video.
The Results
After the intervention, 22/30 (73%) submitted the Unit 8 Project. Submission rate increased by 17.2%. I can see that the YouTube video was viewed 24 unique times. It’s worth noting that the Unit 8 Test had a 76.6% (23/30) completion rate in my current course. Only one more student completed this assessment than the Unit 8 Project. Based on these results, I recommend including the teacher example video in all future Oceanography A courses.
Jim Barry
AP English Literature and Composition
This course is the first semester of a two-semester sequence. For a year, students participate in an AP upscale dining experience in the AP Literature and Composition course. Students act as food critics of exquisite literary cuisine. Menu items include reading, analyzing, writing, rewriting, and discussing creations by the master chefs, renowned authors. With intensive concentration on composition skills and on authors’ narrative techniques, this dining experience equips students with recipes for success in college, in a career, and on the AP exam.
The Problem
Based on the AP Literature and Composition engagement performance data, it became apparent that minimal instruction was being offered related to the literary concepts of irony (situational, verbal, dramatic) and euphemism. The multiple choice quiz performance results for 8.3 The History Teacher Quiz show an average score of only 61.2%. This does not indicate a thorough engagement in or understanding of these concepts.
The Change Idea
Supplemental material was included on the course Announcement Page. Links to supplemental content targeting these concepts were offered on the Weekly Pacing Guide one to two weeks prior to the quiz date. Since the notion of what is ironic or that which is deemed irony in a literary sense is often misidentified or misunderstood, examples were added to augment course content. Three examples of irony and multiple instances of euphemism were offered to provide a more engaging learning experience, the three examples on the Change Idea example page at
The Result
There was improvement on the 8.3 The History Teacher Quiz from 61.2% historically to 65.3%. However, only a 4% improvement in performance indicates that students continue to misread the distinctions among the three types of literary irony. This may be, in part, that differentiating among these three types can be subtle. As a result, supplemental examples, additional practice in identifying types of literary irony, or an alternative means to show mastery are some possible options toward improving these scores and student understanding. Finally, additional multiple choice practice opportunities would also enhance preparedness for the AP exam.
Ryan Call and Lori Coyle
AP U.S. History
Advanced Placement U.S. History I is a college-level introductory course examining the nation’s political, diplomatic, intellectual, cultural, social, and economic history from 1491 to 1877. Students are challenged to see American history through a variety of historical themes while developing thinking skills that will help them contextualize specific periods of American history.
The Problem
AP U.S. History is among one of the toughest AP Exams offered by the College Board. We found that our students were continuously receiving lower scores on their multiple choice tests compared to the other assignments in the course. The mean score for a unit test was at 75% or below. Upon investigation, we determined this could be happening for two reasons. First, the multiple choice tests are set up where students need to have solid skills in analyzing documents such as a primary resource, a passage, a quote, or an image. Upon looking in the first unit of our course, we noticed students were not offered any practice activities or resources in which to expand their document analyzing skills. Second, students weren’t given enough practice with reading and interpreting test questions in order to effectively answer the questions once it came time to take the unit tests.
The Change Idea
In order to effectively prepare our students for the AP exam, we implemented the following two change ideas and added them to our course. First, we created a Document Analysis as a practice activity for all students to practice the skill of analyzing passages. This activity was strategically placed before the first short answer assignment and the unit test. We also added it to our weekly announcements for students to use continually throughout the semester. Second, we used example practice questions from the AP College Board website to create practice quizzes which we then added to our course in Blackboard. This way students had the opportunity to answer some practice questions before taking the unit test. We also set tracking on the practice quizzes so we could determine if students were actively completing them before taking a unit test.
The Results
After implementing the ideas outlined above for the first two unit tests of second semester (Units 6 and 7), we found there was a slight increase in student scores for both tests compared to the previous year scores where no practice opportunities were implemented in the course. As outlined in Table 2 below, our results showed that Unit 6 scores increased by 5.3% and Unit 7 scores increased by 2%.
| Multiple Choice Test | 2017 (no practice tests) | 2018 (practice test include) |
|---|---|---|
| Unit 6 Test (40 points) | 24.58 points (64.7 %) | 28.002 (70%) |
| Unit 7 Test (50 points) | 33.12 points (69.0%) | 35.07 (71%) |
Therefore, we will continue to use and implement these strategies going forward. Furthermore, we would recommend that all Michigan Virtual AP Courses include practice quizzes in order to better prepare our students for the AP Exam.
Closing Thoughts
At face value, it is clear from the posts in parts 1 and 2 of this blog series that some interventions were more outwardly successful than others. Focusing only on outcomes, however, misses the tremendous growth that occurred over the course of the PLC. Teachers were asked to identify problems in their courses and to develop interventions to help solve those problems. While some of the interventions did seem to be effective, at least in this particular context, the process of using data to make decisions about a course in combination with all of the intimate knowledge that teachers possess about courses with which they are familiar to identify and develop solutions is equally noteworthy. This process is one that is invaluable, is not cost prohibitive, does not require extensive technical or statistical knowledge, and stands to lead to real change in student outcomes.
