

What are Data Practices?
Data are powerful, both in science and science education as well as in our everyday lives. By preparing students to think about data, students can question the claims of scientists, news media, and experts in marketing by questioning what data were collected – and how. Moreover, by preparing students to think with data, students can use data to answer questions that are relevant and interesting to them. Being able to think of and with data is powerful not only in science (and other STEM areas of study) but also in occupations that did not traditionally involve a focus on data, such as journalism.
This post explores the topic of work with data, particularly a set of activities, or what the Next Generation Science Standards [1] (NGSS and the similar Michigan Science Standards) and the Common Core State Standards (CCSS) refer to as “practice.” In short, these are activities akin to what experts in STEM—scientists, mathematicians, engineers, and even data scientists—do. To refer to practices focused on work with data, we use the term “data practices.” Data practices draw not only from the practices of developing and using models and analyzing and interpreting data, but also obtaining, evaluating, and communicating information and, in many cases, using mathematics and computational thinking.
Opportunities and Challenges for Data Practices in Online Science Classes
Past research has shown that engaging in data practices is educationally powerful and valuable on its own, involving demanding (and engaging) reasoning skills in science (Lehrer & Schauble, 2015). In addition, they are noteworthy because of how they provide a way to integrate across STEM domains. While mathematics is used in science, and scientific questions provide a context for some problem-based work in mathematics, for example, how to meaningfully learn both about and how to do science and mathematics has been a challenge for us as educators.
In science, many data practices are possible to carry out in any learning environment—face-to-face, blended, or fully online. One affordance for engaging students in data practices in online science classes is that teachers and students already have many of the tools that are needed. Accessing data, wrangling and modeling data, and creating figures have long required digital tools (Lehrer & Schauble, 2015). Building on this opportunity to use powerful tools that are already available to students in online classes, the remainder of this post is focused on how simulations, common in online classes, can be modified to engage students in data practices focused around collecting data and generating model-based explanations for a real-world phenomenon.
A Design-based Research Study in a Michigan Virtual School AP Physics Class
In the 2016-2017 school year, I carried out a design-based research study on students’ use of a simulation as part of a Michigan Virtual college-level AP Physics 2 class. The goal of the study was twofold: a) design a series of activities around collecting data from a simulation and then creating an explanation using a model, and b) systematically document what students learned from their involvement in the activities. I worked closely with the instructor of the course, who had extensive expertise in the science content (thermodynamics and the kinetic theory of matter) and the use of modeling and simulations. These activities were designed around the existing curriculum: this study was focused on the second unit of the class, with the three activities serving as a unit-long supplement to the existing instruction.
Design of the Simulation and Activities
The primary goal of the activities was for students to develop model-based explanations to answer the question: What affects the time it takes for a smell to travel across the room? This question was the “driving question” for the activities and drew from the goals of an existing unit and past research (Schwarz et al., 2009). We used a Lab Interactive, a simulation tool designed by the Concord Consortium. In particular, Lab Interactive simulations are “shareable, embeddable, and authorable components defined in JavaScript Object Notation.” We adapted an existing simulation (about the diffusion of gas molecules) and designed three associated activities described in this section.
Activity 1: Tinker with the Simulation.
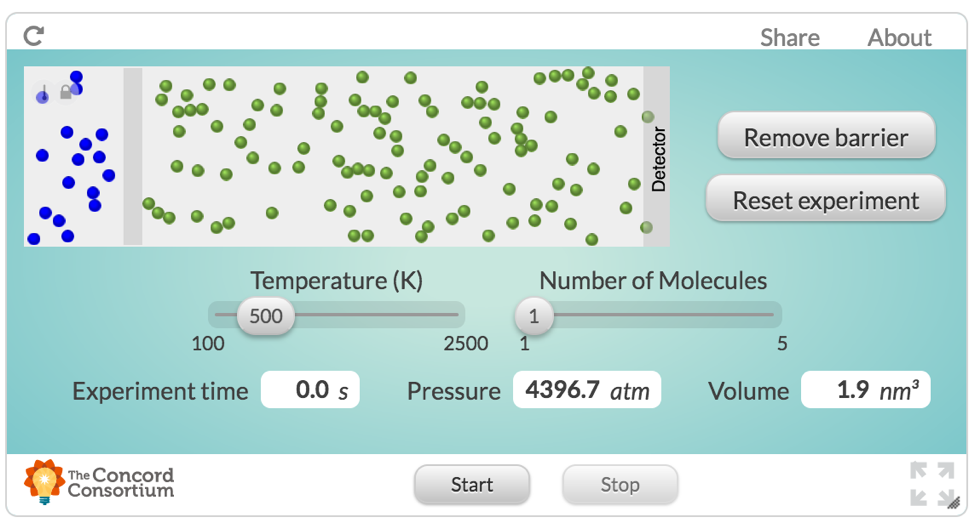
The aim of this activity was to provide the chance for students to be introduced to the simulation and have time to tinker with it. In this activity, students accessed the simulation (available here and presented in Figure 1) and responded to questions that prompted them to generate ideas about what they understood about how temperature, pressure, and volume are related, and what they thought would happen in the simulation both before and after tinkering with it.
Figure 1. The Lab Interactive simulation that we designed for this study based on an existing simulation about the diffusion of molecules.
Activity 2: Collect Data from the Simulation.
The aim of this activity was for students to generate a plan for collecting data and to collect the data for a class dataset. Students were prompted to answer questions about how they would collect the data (what they would specify as temperatures and number of molecules needed to stop the detector and how many runs of the simulation they would carry out). After collecting the data, students were asked to share a Google Sheets file, with the sole requirement being that they collected (at a minimum) information on the temperature and experiment time.
Activity 3: Generate a Model-based Explanation Using a Class Dataset.
The aim of this activity was for students to use the class dataset to generate a model of the data and a model-based explanation as an answer to the driving question, “What affects the time it takes for a smell to travel across the room?” Students were asked to explore the data in any way they liked, such as through calculating descriptive statistics for the data or creating figures. They were prompted to model the relationship between temperature and experiment time using a scatterplot and a line of best fit and to generate an explanation for the relationship between the temperature and the experiment time in light of the model they selected.
Findings
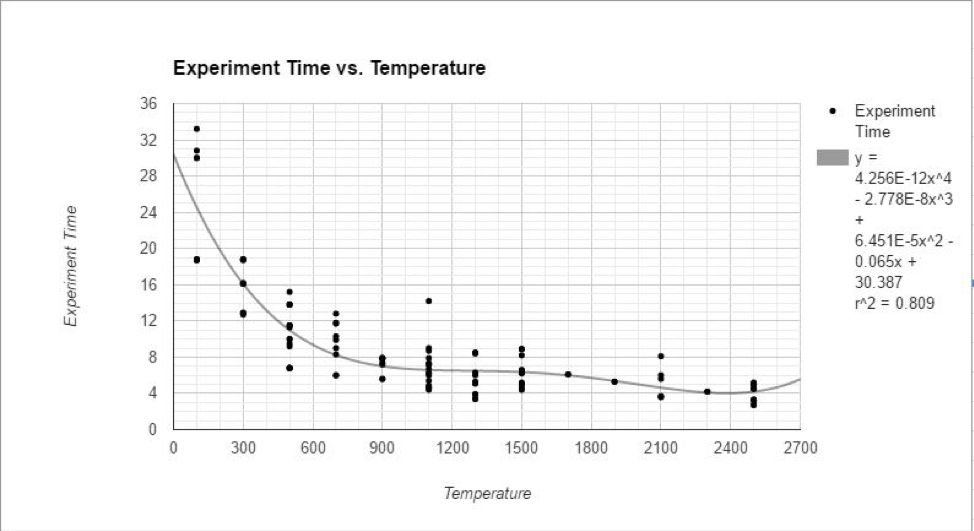
Though based on activities completed in only one semester, we found that students were able to demonstrate capabilities that can be beneficial to their learning. For example, in the third activity, students were asked to consider how simple models are often preferred in science because they are more easily interpretable. One student, in an impressive response (the graph from which is presented in Figure 2), wrote, “I used this 4th power polynomial function because it had a much higher R2 value than the linear, exponential, and lower degree functions.” This student concluded that a 4th-degree polynomial was the most appropriate model, as “Having a polynomial function with a higher degree of 4 makes it really laborious to manipulate and use to predict values.” While this is only one response from one student, other responses suggest that the complex, messy data that students generated and then used as part of a class dataset provided a context to consider sophisticated aspects of modeling data.
Figure 2. Example data model created by a student as part of an explanation of the relationship between temperature and time.
In addition to findings related to students’ responses and how they decide what model to fit the data, we took away some lessons from designing these activities, reviewing students’ work, and reflecting on our experience. These lessons take the form of recommendations both general to using data in online science classes and specific to the use of simulation-based activities.
- First, we recommend considering using larger, even “messy” sources of data to provide improved benefits to students’ learning. While it is important to weigh the benefits of students’ use of more complex data against the practicality of collecting and modeling these sources of data, it may be important for students to make decisions about how to model the type of data encountered in advanced coursework (and many occupations).
- Second, we recommend that future activities include opportunities for students to ask their own questions. In many cases, determining which data to collect in order to answer a specific question is not always straightforward or clear. While in these activities students made decisions about how much data to collect (and what variables to collect data on), more open-ended activities may help students develop the capability to generate and answer questions based on their interests and curiosity.
- Third, we recommend that instructional designers and teachers use a combination of general (i.e., Google Sheets) and specialized (i.e., the Common Online Data Analysis Platform) tools when appropriate to engage students in data practices. Tools that are specially-designed as educational tools for data analysis, such as the Common Online Data Analysis Platform (CODAP), can connect directly to sources of data (such as the Lab Interactive simulation we used) and make it even more intuitive for students to model and create graphs from data.
- Fourth, we recommend that when simulations are used, have students “tinker” with them first. While “tinkering” or playing with a science simulation takes time, these opportunities can provide students with a chance to start to generate ideas about how the simulation works. Many times, students set the simulation to its limits (i.e., to the lowest or highest temperature for the simulation we used) to “break it.” However, this can (potentially) support students’ effort to understand how well the simulation corresponds to the real-world in both every day and extreme situations.
- Fifth, we recommend that those designing simulations make them authentic to the phenomenon they represent —at least in some cases. This simulation was designed to output quantitative data in the same units for volume, pressure, and temperature that students encounter in many assignments beyond the simulation. This allowed students to easily create and model quantitative output from it, which can be highly difficult if the simulation was designed to permit qualitative interpretation of the output.
Conclusion
Being able to think of and with data is a powerful capability, not only in STEM but also in other areas of study and many occupations, including those that did not previously involve intensive work with data. Work with data, particularly collecting and modeling data, connects to many of the practices described in recent science curricular standards as well as others, such as obtaining, evaluating, and communicating information and constructing explanations. Findings and recommendations from this design-based research study provide some key ideas for the design and teaching of activities to engage students in data practices. What students learn through completing these and other activities in online science classes at Michigan Virtual is, then, a worthwhile topic for instructional designers, teachers, and researchers to consider in their future work.
References
Lehrer, R. & Schauble, L. (2015). Developing scientific thinking. In L. S. Liben & U. Müller (Eds.), Cognitive processes. Handbook of child psychology and developmental science (Vol. 2, 7th ed., pp. 671-174). Hoboken, NJ: Wiley.
Winsberg, E. (2010). Science in the age of computer simulation. Chicago, IL: University of Chicago Press.
