Introduction and Need for Study
Instructional designers and administrators at Michigan Virtual sought to better understand student engagement with interactive course elements in online courses, and whether those elements relate to student learning. While this study does not provide casual estimates of the relationship between interactive course elements and students’ learning outcomes, it does provide correlational and descriptive evidence to inform course design. It could also serve as the foundation for future research to rigorously test the impact of particular course elements. Building on Michigan Virtual’s existing research focused on student engagement (e.g., Kwon 2017) and course elements (Lin, 2019; Zheng, 2018), this study contributes to a larger body of evidence about how to create learning environments to support students’ academic outcomes.
This study addressed the following research questions based on data from Michigan Virtual science courses in fall 2021:
What percentage of students engaged with each type of course element?
Are there differences between students in the top and bottom quartile of total course points?
How did engagement vary by school-level socioeconomic status and IEP status?
What proportion of students’ total course points came from graded interactive course elements?
What was the correlation between student engagement with interactive course elements and student learning outcomes?
Methodology
These questions were addressed using course activity data, enrollment data, and gradebook data for students in Michigan Virtual’s science courses. Science courses were selected because they utilize a variety of interactive course elements and because few studies of online learning focus on science (Sahni et al., 2021). Most of the existing research has focused on outcomes in mathematics or English language arts. While this study focused on one subject, the analytic approach, including descriptive and regression analysis, could be replicated for all subjects.
Sample and Data
The sample included 1,983 students who were enrolled in 22 Michigan Virtual online science courses during the fall 2021 semester. However, only 1,200 students in 14 courses had interactive course elements. Students in trimester enrollment and students who dropped during the grace period were excluded from the analysis. In the latter case, a student’s decision to drop a course during the grade period is assumed to be exogenous to the presence of the interactive course elements examined in this study. A single course enrollment was randomly selected for students who were enrolled in multiple courses.
Data included information about student enrollment (e.g., whether the student enrolled on-time), indicators for the school the student attended, student course activity, and student outcomes. Student course activity included data on students’ interactions with various course elements and their progress in the course. Data also included information about course subject and section. Student outcomes were based on gradebook data, including points attempted and points earned for each gradebook object, and total points for the course. These were used to create the following student outcomes: grade was equal to points earned divided by points possible and percent earned of attempted was equal to points earned divided by points attempted. As described in more detail below, the descriptive analysis focused on course grades while the regression analysis focused on unit grade and percent earned of attempted in the unit in order to control for student and course characteristics that may influence both outcomes and students' decisions to engage with the interactive course elements.
Definitions
Interactive course elements: Interactive course elements are learning activities where students actively engage with material, for example by clicking, hovering over material, or dragging and dropping content. Only interactive course elements that were tracked were included in the study. Some course elements, such as text-based resources were not tracked, and therefore were excluded from the study.
Types of interactive course elements: Interactive course elements were grouped into the following categories:
Interactive assessment: classification, quiz, self-check, writing
Interactive instructional activities: image labeling, image matching, interactive categorization, interactive matching, image hotspots
Interactive flashcards: flashcards, flashcards with images
Engagement: A student engaged with an interactive course element if the student either clicked on the course element, or in some cases, completed the learning activity and clicked a button to “submit” their work. The word engagement for this study will be inclusive of both scenarios.
Gradebook object: A gradebook object is an assignment, quiz, discussion, lab, or test where a student could earn points toward their final grade.
Gradebook objects that were related to content objects: A content object, which is a lesson or portion of lesson in a course, with the same unit and/or lesson number and similar title as a gradebook object was considered related to the gradebook object.
Grade: Grade is equal to total points earned divided by points possible. Students’ grades were calculated for each gradebook object, unit, and course.
Percent earned of attempted: Percent earned of attempted in the course is equal to points earned in the course divided by points attempted in the course. Students’ grades were calculated for each gradebook object, unit, and course.
Analytic Approach
The first two research questions were analyzed descriptively. The engagement rate for each type of interactive course element was calculated in the same way as the overall engagement rate, which was equal to the number interactive course elements the student engaged with divided by the number available in the course (see Box 1 for definitions). To address the fact that students who did more of the course would have higher engagement rates, the denominator was also restricted to the number of interactive course elements in units where the student attempted to earn points. Engagement rates were then calculated for students in the top and bottom quartile of their course grades and by school characteristics. The results were organized by interactive course element and by type: interactive assessments, interactive flashcards, and interactive instructional activities. In addition, the number of students who engaged with each type of interactive element at least once was also presented.
To address research question two, the average grade was calculated from gradebook objects that were related to interactive course elements and compared grades across gradebook objects with different types of interactive course elements. For context, the report presents the percentage of points possible from interactive course elements calculated as the total points possible for the gradebook object related to interactive course elements divided by the total points possible in the course. If the average grade is greater than the percentage of points possible from interactive course elements, then students would be disproportionately earning course points from interactive course elements.
The third research question was addressed by using a student fixed effects model where a student's grade was the main outcome and the percentage of interactive course elements the student engaged with as the main explanatory variable. The problem with doing a simple ordinary least squares model is that there are other factors that may influence both students’ choice to engage with an interactive course element and their course outcome.
Examples of these factors are prior academic achievement or interest in the topic. Therefore, this potential omitted variable bias was addressed by taking advantage of the panel structure of the data. That is the outcomes for the model were the unit grade and unit percent earned of attempted. The main explanatory variable was the percentage of interactive course elements that students completed in that unit. Student fixed effects controlled for all time-invariant characteristics of the student, such as their prior year test scores, timing of enrollment, as well as the course and section. The main explanatory variable therefore was estimated using variation across units for each student rather than across students.
Only units where the students attempted to earn points were included in the analysis because students by definition cannot do interactive course elements in units that they had not reached. The model also included indicator variables for unit because students’ grades tended to decrease as they progressed through the course. The standard errors were clustered at the section level because students were nested within sections within courses.
Engagement with Interactive Course Elements
The fourteen science courses with interactive course elements were designed using the same platform. Each course had between 4 and 16 units. There were a total of 781 course elements, 306 or 39% of them had an interactive course element. Nearly all of the interactive course elements were related to gradebook objects; with the majority 73% used to prepare students for either a quiz or a test. On average, students engaged with 34% of the interactive course elements in their courses; this number increased to 40% when only including units where students attempted to earn points, and 45% when the sample was restricted to students who attempted all units.
Of the interactive course elements, quizzes and flashcards were available in the most courses, appearing in 11 and 9 courses, respectively. The number of flashcards and quizzes was the highest because each flashcard or quiz question had a unique code and therefore was counted as its own element. As such, the number of students who had an opportunity to engage with each type of interactive course element followed a similar pattern, with the greatest number of students interacting with at least one quiz or flashcard. Approximately 78% of students who had a flashcard activity in their course completed at least one. Interactive matching elements, quizzes, self-checks, and writing elements were the next highest with 71% to 73% of students completing at least one. The average engagement rates, however, were highest for classification and self-checks when engagement rates were calculated based on the availability of interactive course elements in units where the student attempted to earn points.
Engagement based on course performance and school characteristics
Students who had higher course grades engaged with more of the interactive course elements. This analysis only included students who completed the course because students who made it further in the course had more opportunities to engage with interactive course elements. Students in the top quartile of course grades engaged with more interactive course elements than students who were in the bottom quartile. On average, students in the top quartile engaged with about half the interactive course elements, while students in the bottom quartile engaged with a little more than a third of them. On average, students in the top quartile engaged with 16 interactive course elements compared to 10 for students in the bottom quartile. These differences in engagement rates hold for all three types of interactive course elements: 45% compared to 37% for interactive assessments, 54% compared to 40% for interactive instructional activities and 50% compared to 35% for interactive flashcards. These gaps in engagement rates nearly double if the bottom quartile included students who did not attempt all units in the course.
When examining data on school characteristics, engagement rates did not differ based on the percentage of students in their brick-and-mortar school who received special education services, but there were some differences based on the percentage of students in their brick-and-mortar schools who were considered economically disadvantaged. Online students from schools with the lowest percentages of students from economically disadvantaged communities (i.e. bottom quartile) engaged with 46% of the interactive course elements available compared to 40% for online students in schools with the highest percentages of students from economically disadvantaged communities (top quartile). It should be noted that there were far more online students in the sample from the bottom quartile (n=430) than the top quartile (n=40), meaning that there are fewer students in this sample who were enrolled in schools with the highest percentages of students from economically disadvantaged communities.
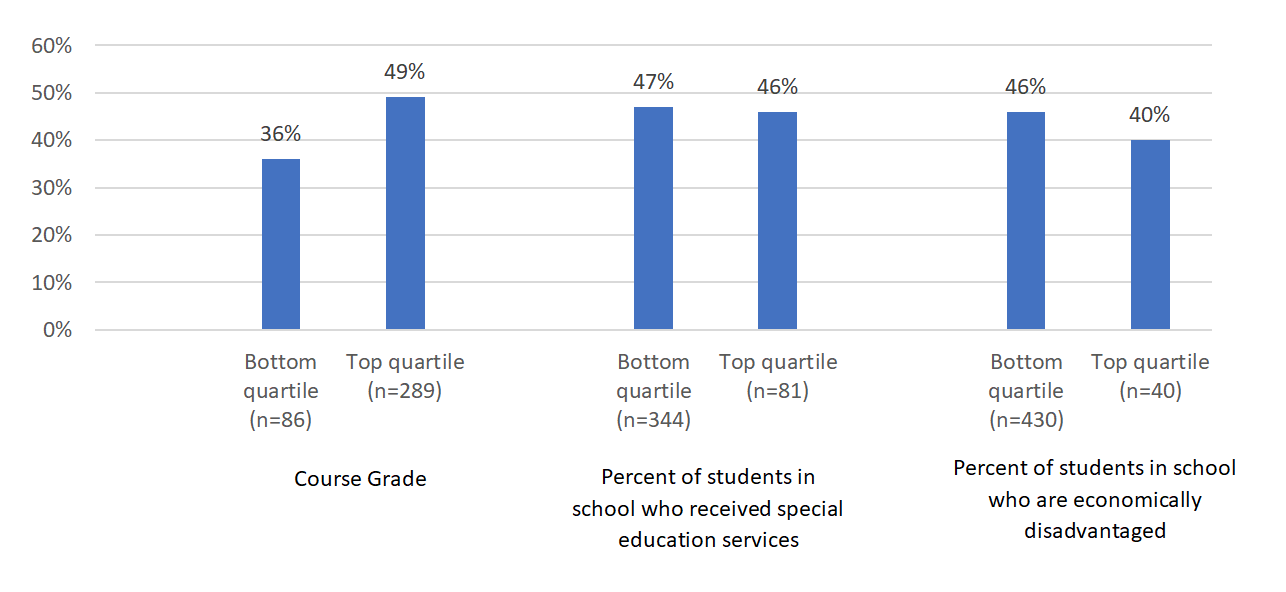
Figure 1: Student Engagement with Interactive Course Elements in Supplementary Online Science Courses
Course Points from Interactive Graded Elements
The proportion of total course points possible from gradebook objects with related interactive course elements varied by course. For example, in Anatomy & Physiology A, 89% of the possible points were from gradebook objects with related interactive course elements. In Physics A, only 2% of the possible points came from gradebook objects with related interactive course elements. In that course, only one gradebook object had a related interactive course element. Despite the wide range of possible points, the percentage of total points earned that came from gradebook objects with related interactive course elements was similar to the percentage of total points possible from gradebook objects with related interactive course elements. If these numbers had been different, it would have suggested that these gradebook objects were contributing more or less than gradebook objects without related interactive course elements. It is important to note that this analysis only included gradebook objects that were attempted.
What did vary, however, was the percentage of points earned from each type of gradebook object. That is, students performed better on assignments and discussions than quizzes and tests. On average, students earned 88% of the points from discussions with related interactive course elements and 87% for assignments compared to 80% for quizzes and 76% for tests. This aligns with previous research indicating that teacher-graded assignments contribute more to students’ grades than auto-graded assignments (Lin, 2019).
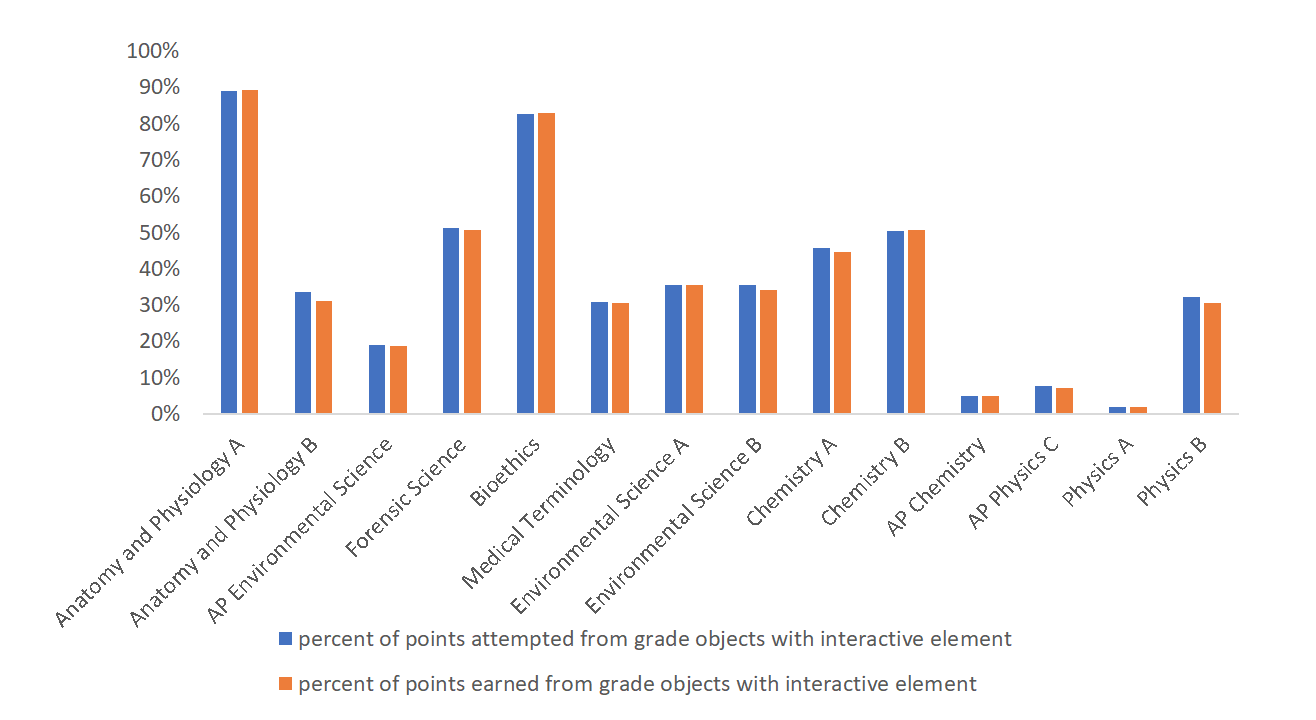
Figure 2: Course points from gradebook objects with interactive course elements
Positive Correlation between Student Engagement with Interactive Course Elements and Student Outcomes
There is a positive correlation between the percentage of interactive course elements that students engage with in their course and their course grade (r=.57). As noted in the methodology section, students who engage with interactive course elements may exhibit other behaviors or have characteristics that would make them both more likely to engage with interactive course elements and perform better in their courses (e.g., prior academic achievement, interest in the subject). Similarly, courses with more interactive course elements may also be harder courses. While the average course grades in courses with interactive course elements was not statistically different than in courses without interactive course elements, the number of interactive course elements was negatively associated with average course grades (rho=-.18) for courses with interactive course elements. Thus, we employed a student fixed effects model to account for differences across courses and for time-invariant student factors.
The fixed effects analysis indicated that students performed better in units where they completed a higher percentage of the interactive course elements (Table 2 in Appendix). An increase in the percentage of interactive course elements that a students engaged with in the unit was associated with an increase in the students’ grade for the unit and the percent earned of attempted for the unit.
One limitation of this analytic approach is that the estimated coefficients were only based on data for units where interactive course elements were available because the denominator for the explanatory variable is the number of interactive course elements in the unit. To address this limitation, a second regression model was used that replaced the engagement rate with a categorical variable to capture students’ engagement with interactive course elements in each unit. The three categories were: (1) no interactive course elements in the unit; (2) interactive course elements were available in the unit, but the student did not engage with any; and (3) the student engaged with at least one interactive course element. These models still focused on the 14 courses with interactive course elements.
The results align with the previous findings. Students had better outcomes in units where they engaged with at least one interactive course element compared to units where interactive course elements were present, but they did not engage with them. There were statistically significant differences in unit grade (F[1,46]=14.81; p=.0004) and in percent earned of attempted in the unit (F[1,46]=11.061; p=.0017). However, there were no significant differences when comparing students’ performance in units that did not have interactive course elements to units where students did not engage with the interactive course elements. Similarly, there were no significant differences when comparing students’ performance in units that did not have interactive course elements to units where the students engaged with interactive course elements.
Looking more specifically at the types of interactive course elements, the unit engagement rates for flashcards were positively associated with points earned of attempted. While the coefficients on interactive instructional activities and interactive assessments were positive, they were not statistically significant.
Implications
This study provides initial evidence about students’ engagement with interactive course elements and the relationship between engagement rates and students’ learning outcomes. The findings have implications for both course design and for future research.
Interactive course elements may be an important part of science course design
Students who engaged with interactive course elements had higher unit grades and a greater percentage of points earned of attempted. It does not appear that these interactive course elements inhibit or pull attention away from other material. The positive findings in this study provide evidence of promise to warrant additional rigorous research on the efficacy of interactive course elements. Further, there was variation in how many interactive course elements were available in these sciences courses. It may be useful to consider piloting additional interactives in courses where few or none exist.
The results align with prior research on the importance of timely feedback.
Decades of research suggest that timely and targeted feedback supports student learning (e.g., Hattie, 2009; Marzano, Pickering, & Pollock, 2001). Prior research in digital learning applications also demonstrated that students who receive immediate feedback had better learning outcomes than students who receive delayed feedback (e.g. Razzaq, Ostrow, & Heffernan, 2020). The interactive course elements studied here, such as flashcards and quizzes, provided immediate feedback to students as they progress through the course and prepare for assignments and assessments.
More research is needed to determine optimal types of interactive course elements and their placement in the course.
Students’ engagement with interactive course elements did not directly contribute to course grades, but rather covered content in assignments or provided students with a review prior to tests or quizzes. Areas for future inquiry include determining where in the courses interactive course elements are most impactful, and whether it would be beneficial to directly tie interactive course elements to the gradebook. There was also variation in student engagement based on the types of interactives, suggesting that some may be more appealing to students than others, which is another important area for future research. In addition, future research could determine which types of interactive course elements were most impactful for student learning.
References
Hattie, J. (2009). Visible learning: A synthesis of over 800 meta-analyses relating to achievement. New York: Routledge.
Kwon, J., Debruler, K., & Kennedy, K. (2019). A snapshot of successful K-12 online learning: focused on the 2015-16 academic year in Michigan. Journal of Online Learning Research, 5(2), 199-225. https://files.eric.ed.gov/fulltext/EJ1229422.pdf
Lin, C. H., Zheng, B., & Kwon, J. B. (2016). Interactions and learning outcomes in online language courses. British Journal of Educational Technology, 48(3), 730-748. https://doi.org/10.1111/bjet.12457
Marzano, R., Pickering, D., & Pollock, J. (2001). Classroom instruction that works: Research-based strategies for increasing student achievement. Alexandria, VA: ASCD.
Razzaq, R., Ostrow, K.S., Heffernan, N.T. (2020). Effect of Immediate Feedback on Math Achievement at the High School Level. In: Bittencourt, I., Cukurova, M., Muldner, K., Luckin, R., Millán, E. (eds) Artificial Intelligence in Education. AIED 2020. Lecture Notes in Computer Science, 12164. Springer, Cham. https://doi.org/10.1007/978-3-030-52240-7_48
Sahni, S. D., Polanin, J. R., Zhang, Q., Michaelson, L. E., Caverly, S., Polese, M. L., & Yang, J. (2021). A What Works Clearinghouse rapid evidence review of distance learning programs (WWC 2021-005REV). U.S. Department of Education, Institute of Education Sciences, National Center for Education Evaluation and Regional Assistance, What Works Clearinghouse. https://ies.ed.gov/ncee/wwc/Docs/ReferenceResources/ Distance_Learning_RER_508c.pdf
Zheng, B., Lin, C. H., & Kwon, J. B. (2020). The impact of learner-, instructor-, and course-level factors on online learning. Computer Education, 150, 103851. https:// doi.org/10.1016/j.compedu.2020.103851
Appendix
Number of courses with interactive course elements | Number of interactive course elements | Number of students who had at least one interactive course elements available in their course | Percent of students who engaged with at least one interactive course element | |
|---|---|---|---|---|
Interactive assessment |
|
|
|
|
Classification | 2 | 7 | 183 | 64% |
Interactive Matching | 9 | 33 | 927 | 72% |
Quiz | 11 | 305 | 1,048 | 73% |
Self-Check | 4 | 72 | 166 | 73% |
Writing | 2 | 41 | 112 | 71% |
Flashcards |
|
|
|
|
Flashcards | 9 | 154 | 978 | 78% |
Flashcards with Images | 2 | 2 | 145 | 39% |
Interactive instructional activities | ||||
Image Hotspots | 3 | 7 | 273 | 8% |
Image Labeling | 5 | 26 | 513 | 57% |
Image Matching | 7 | 25 | 722 | 48% |
Interactive Categorization | 7 | 22 | 945 | 57% |
Table 1: Interactive course elements
(1) | (2) | (3) | (6) | (7) | (8) | (4) | (5) | |
|---|---|---|---|---|---|---|---|---|
Engagement rate | 0.099** | 0.031** | 0.009+ |
|
|
|
|
|
Engagement rate for interactive assessments |
|
|
| 0.008+ |
|
|
|
|
Engagement rate for interactive flashcards |
|
|
|
| 0.01** |
|
|
|
Engagement rate for interactive instructional activities |
|
|
|
|
| 0.002 |
|
|
Categorical engagement (reference = no interactive course elements) | ||||||||
Available, but did not do any |
|
|
|
|
|
| 0.011 | 0.012 |
Did at least one |
|
|
|
|
|
| 0.032+ | 0.024 |
Only units attempted |
| X | X | X | X | X | X | X |
Number of observations | 8,847 | 6,999 | 6,999 | 6,038 | 5,258 | 4,464 | 8,021 | 8,021 |
Number of students | 1,199 | 1,125 | 1,125 | 1,125 | 913 | 956 | 1,125 | 1,125 |
Rho | .867 | .845 | .811 | .811 | .841 | .823 | .846 | .807 |
Table 2: Regression Results