Introduction
This report presents an analysis of information on virtual learners reported by schools to the state and shares findings in a highly consumable way to aid the evaluation of virtual learning programs. This year’s report is the 13th edition of this annual publication and completes 15 years of data on K-12 virtual learning in Michigan.
The report is organized into several sections. Each section is meant to capture the essential findings without being overly intensive; however, data tables have been included in the appendices to provide those interested with more in-depth information. Information about the report’s methodology is captured in Appendix A. Please note that in some tables and figures, percentages may not sum to 100% due to rounding.
Schools
Fast Facts
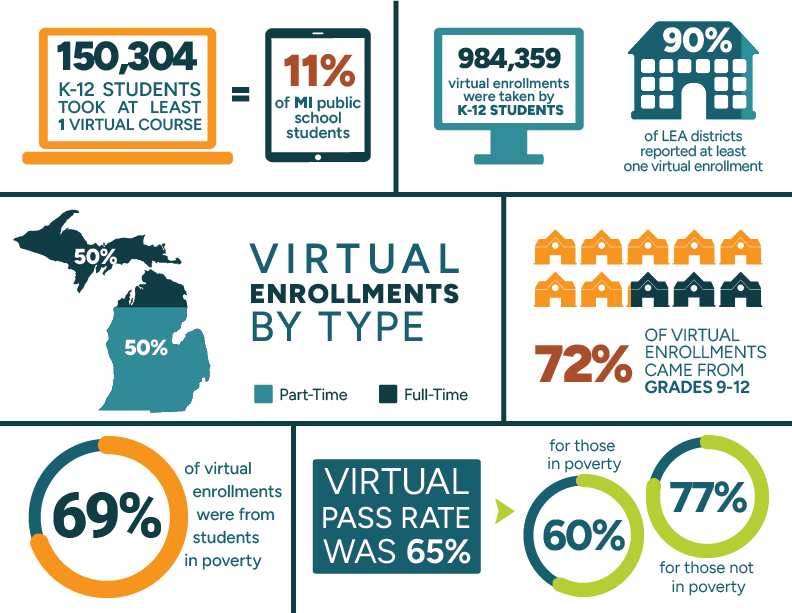
- 100% of ISDs, 90% of LEA, and 33% of PSA Districts reported at least one virtual enrollment in 2024-2025.
- 42% of LEA schools reported virtual learners compared to 33% of PSA schools.
- 1,363 schools reported at least one virtual enrollment. This is a decrease of approximately 4% compared to last year's value of 1,421.
- 10% of this year's schools did not report any virtual enrollments the prior year. These 139 schools added 8,296 enrollments with a 59% pass rate.
- 90% of this year's schools also reported virtual enrollments last year. They accounted for over 976,000 enrollments with a pass rate of 65%.
- 197 schools that offered virtual learning the prior year did not report any for this year.
- 57% of the 1,363 schools with virtual enrollments had 100 or more virtual enrollments. These higher-volume schools accounted for 98% of virtual enrollments.
- 78% of schools with virtual enrollments had a general education school emphasis; 20% had an alternative education emphasis.
- 88% of schools with virtual learning were LEA schools.
- LEA schools accounted for 59% of the virtual enrollments; PSA schools generated 39% of the virtual enrollments.
- Approximately 50% of virtual enrollments came from schools with part-time virtual learning options.
- LEA schools represented 70% of the full-time virtual schools.
- 72% of virtual enrollments came from students in grades 9-12.
- 39% of virtual enrollments came from Suburban schools, the most of any locale.
- Schools with a general education emphasis had a 73% virtual pass rate, outperforming those with an alternative education emphasis, which had a pass rate of 54%.
- 27% of schools had a school-wide virtual pass rate of 90% to 100%, a decrease of two percentage points from last year.
Number of Districts and Schools
From a district perspective, 100% of ISD Districts (57, including the State of Michigan) had virtual learners in 2024-25. Four hundred eighty-four of the state’s 540 LEA districts (90%) reported virtual learning. PSAs reported at a considerably lower rate, with only 95 of the state’s 286 districts (33%) reporting at least one virtual learner. Diving a little deeper, 1,201 of the state’s 2,829 LEA schools (42%) reported virtual learning. 119 of the state’s 364 PSA schools (33%) did. Information about the population of state districts and entities for the 2024-25 school year can be found at https://mischooldata.org/districtschool-count/.
When looking over the last two years, schools fell into three categories, which are also captured in Table B1:
- Leaving - 197 schools had virtual enrollments the prior year (2023-24) but did not report any virtual enrollments in 2024-2025. Last year, those schools accounted for a total of 28,093 virtual enrollments and had a pass rate of 73%.
- Returning - 1,224 or 90% of schools in this year's dataset reported virtual enrollments in both 2023-24 and 2024-25. This year, these schools generated 976,063 enrollments and had a pass rate of 65%, which was two percentage points higher than their rate in 2023-2024.
- New - 139 schools reported virtual enrollments this year (2024-25) that did not last year. Those schools accounted for 8,296 enrollments, with a pass rate of 59%.
197,635 of this year's enrollments came from 18 schools that reported 1,000 or more enrollments than they did in 2023-24. On the other hand, 17 schools reported decreases of 1,000 or more virtual enrollments this year. Despite these declines, these schools yielded 106,395 virtual enrollments this year. See Table B2. These enrollment declines are close to those observed in 2022-23. About 19% of schools in both years saw their pass rates increase by 10 or more percentage points from the prior year. See Table B3.
By Grade Level
There were 984,359 virtual enrollments across the 1,363 schools. Students in 12th grade generated the most virtual enrollments (248,107), representing 25% of all virtual enrollments. There continued to be a smaller percentage of high school virtual enrollments than before the pandemic, although this number appears to be slowly growing. In the 2019-20 school year, 81% of the virtual enrollments came from students in high school; this year, high school enrollments were up approximately one percentage point from last year, and accounted for approximately 72% of the virtual enrollments. It seems likely that this percentage will continue moving upward over the next several years.
The overall pass rate for virtual enrollments was 65%, an increase of 2 percentage points over the prior year. See Table G1 for a more specific breakdown of all the completion statuses. This ranged from a high of 81% in first and second grade to a low of 50% in 9th grade.
This year, certain elementary grades (1st, 2nd,3rd, 5th) tended to see smaller pass rate percentage decreases than last year (one to three percentage points), whereas K and 4th grade saw increases of two and one percentage points, respectively. In comparison, an upward trend observed last year among the middle school grades (6th, 7th, 8th) was reversed this year, with small decreases in pass rates (two and four percentage points). The small pass rate decreases observed among the high school grades (9th-12th) last year were reversed this year (increases between three and five percentage points were noted). See Table B4 for more information.
The fairly consistent pattern of a higher pass rate in non-virtual coursework continued. For 2024-25, virtual learners had a 65% pass rate in their virtual courses but a 75% pass rate for their non-virtual coursework. See Table B5. As a pre-pandemic comparison, the 2019-20 school year virtual pass rate was 12 percentage points lower than those students' non-virtual pass rate.
By School-Level Virtual Pass Rate
Of the 1,363 schools with virtual enrollments, 364, or 27%, had school-level virtual pass rates of 90% to 100%. This was two percentage points lower than the prior year. Approximately 60% percent of the schools (818) had virtual pass rates of 70% or higher. This was one percentage point lower than the prior year. See Table B6. Thus, even though the overall pass rate in the state increased, roughly a similar percentage of schools experienced high levels of student performance.
By Entity Type
LEA schools and PSA schools accounted for almost all the virtual enrollments, with 59% and 39%, respectively. Virtual enrollments came from 1,201 (88%) LEA schools, while only 119 (9%) of the schools were PSAs. See Table B7. The pass rates for LEA schools (65%) and PSA schools (64%) were roughly equivalent. While pass rates for both entities increased, PSA schools saw a four percentage-point increase, while LEA schools saw a one percentage-point increase from last year. See Table B8 or, for a more in-depth look at the completion statuses, see Table G2.
By Full-Time Virtual Schools
The number of full-time virtual schools (70) decreased by six from the prior year. Forty-nine of the 70 full-time virtual schools (70%) were LEA schools. PSA schools (18) accounted for 26% of the full-time virtual schools. See Table B9. Despite the sizable difference in the number of schools, PSAs reported more virtual enrollments (63%) from full-time virtual students statewide compared to LEAs (36%). PSA full-time virtual learners saw higher virtual pass rates (67%) than their full-time counterparts in LEA schools (59%). See Table B10 and Table G3. Overall, the number of virtual enrollments from full-time virtual schools decreased from 499,793 in 2023-2024 to 490,800 this year. Approximately 50% percent of the virtual enrollments came from full-time virtual learners.
A quick note about full-time virtual schools: Historically, full-time virtual schools have only provided students with 100% of their learning online. Thus, it was safe to designate all enrollments from such a school as being part of a full-time virtual program. Over the last several years, however, LEAs have started to add full-time virtual options to their offerings. In some cases, this is a separate school, which makes it analogous to cyber schools. However, it seems that schools are increasingly offering multiple forms of online learning (“Full Virtual,” “Face Virtual,” and “Supplemental Virtual”) from the same building code. See page 15 of the Educational Entity Master Glossary for more information on these field values. This means that some schools report various forms of virtual (and sometimes non-virtual) learning from a single building code. Case in point, 8% of the enrollments from virtual learners in LEA full-time programs were not flagged as being delivered virtually, indicating what may be more of a hybrid approach.
By Part-Time Virtual Schools
About 95% of the schools offering virtual learning do so to supplement their face-to-face course offerings. These 1,293 schools, referred to in this report as part-time virtual schools, were predominantly LEA schools (89%). See Table B11. Eighty-eight percent of the part-time virtual students were enrolled through LEA schools, and 11% through PSA schools. LEA schools accounted for 399,983 virtual enrollments or 81% of the part-time enrollments. In total, enrollments from part-time virtual schools accounted for approximately 50% of all the virtual enrollments for the year. LEA schools had a pass rate of 68%, whereas PSA schools had a pass rate of 55%. Overall, the pass rate for the part-time virtual schools (66%) was two percentage points higher than the rate for the full-time virtual schools (64%). See Table B12 and Table G4.
By School Emphasis
Seventy-eight percent of schools with virtual learning were designated as General Education and produced 586,498 (60%) virtual enrollments. Schools with Alternative Education as their emphasis accounted for 396,081 (40%) of the virtual enrollments. See Table B13. There was a considerable difference in virtual pass rates between these two types of schools. General Education schools had a 73% virtual pass rate, whereas Alternative Education schools had a 54% virtual pass rate (see Table B14 and Table G5), though this varied by entity type. LEA schools, for instance, had a 75% virtual pass rate for General Education schools, and a 56% virtual pass rate for Alternative Education schools. See Table B15.
By Number of Virtual Enrollments
Fifty-seven percent of schools with virtual enrollments had 100 or more virtual enrollments. These schools were responsible for 98% of the virtual enrollments (966,276). See Table B16.
Like last year, the trend in which schools with fewer virtual enrollments per student performed better was absent. Schools with 5+ enrollments per student consistently outperformed schools with fewer virtual enrollments. Schools with 3-4 enrollments per student generally had pass rates equivalent to or greater than schools with 1-2 enrollments per student, except for schools where the pass rates were greater than 80%.
Indeed, 39% of schools with an average of one to two virtual enrollments per virtual learner had a pass rate of 90-100%, and 39% of schools with an average of five or more virtual courses per student also had a pass rate between 90-100%. See Table B17.
By Locale
Suburban and Rural schools represented 35% of schools with virtual enrollments. Suburban schools also tallied the largest percentage of the virtual enrollments at 39%. Rural schools were the next closest, providing 32% of the enrollments. See Table B18. In each of the four locales, schools with 100 or more virtual enrollments accounted for the largest percentage of schools. See Table B19. Virtual pass rates varied by locale. City schools, which had the lowest virtual pass rate in 2023-24, had the lowest pass rate again this year at 61%. Town schools saw the greatest change in pass rates with a drop of five percentage points. Suburban schools had the highest pass rates at 70%. See Table B20. On the other hand, Rural and Suburban schools had 47% and 44% of their schools, respectively, achieve building-wide virtual pass rates of 80% or higher. See Table B21. For more information about locales, including definitions, please see pages 23-24 of the Educational Entity Master Glossary.
By School Free or Reduced-Price Lunch Categories
Schools were categorized into one of four categories based on the percentage of all learners at the school (not just virtual learners) that qualified for free or reduced-price (FRL) meals:
- Low FRL (<=25%)
- Mid-Low FRL (>25% to <=50%)
- Mid-High FRL (>50% to <=75%)
- High FRL (>75%)
Similar to last year, none of the categories had 50% or more of its schools report virtual learners. Mid-high FRL had the highest percentage at 44%. The small changes in the percentage of schools from each category with virtual learners may reflect continued stabilization since the pandemic. See Table B22.
While High FRL schools represented only 33% of schools with virtual learners (282), they accounted for 40% of the virtual enrollments. Mid-High FRL schools accounted for 38% of the enrollments. Low FRL schools, on the other hand, reported 9% of the virtual enrollments. The virtual pass rate for Low FRL schools was 86% compared to 60% for Mid-High FRL and 61% for High FRL schools. See Table B23.
By High Enrollment Schools
There were 183 schools that had 1,000 or more virtual enrollments. It is worth noting that these high enrollment schools were less defined by having a larger number of virtual students (87,354 versus 64,766) and more by the number of virtual enrolls per student (8.6 virtual courses per student in the high enrollment schools compared to 3.7 in the non-high enrollment schools).
For high enrollment schools, LEAs (130 schools) had a virtual pass rate of 62% and PSAs (47 schools) had a virtual pass rate of 65%. The corresponding virtual pass rates for virtual enrollments from schools with less than 1,000 enrollments moved in opposite directions. For non-high enrollment schools, the LEA schools’ virtual pass rate was eight percentage points higher (70%), whereas the PSA schools’ virtual pass rate was thirteen percentage points lower (52%). See Table B24 and Table B25.
There was a fairly even split in the number of Alternative Education (94) and General Education (89) high enrollment schools. The virtual pass rate for these schools was 54% and 72%, respectively. Students in high enrollment Alternative Education schools faired slightly better than their low enrollment school counterparts (by one percentage point), whereas the reverse was true for General Education Schools as students in low enrollment schools performed better by three percentage points. See Table B26 and Table B27.
Courses
Fast Facts
- Just under 1M virtual enrollments were taken by Michigan K-12 students; the overall pass rate was 65%.
- Virtual enrollments were spread across 1,086 different course titles.
- 67% of virtual enrollments occurred in the core subject areas of English Language and Literature, Mathematics, Life and Physical Sciences, and Social Sciences and History.
- The course titles with the highest enrollments for each core subject were:
- English Language and Literature: English 9, English 10, English 11, and English 12
- Mathematics: Geometry, Algebra I, Algebra II, and Consumer Mathematics
- Life and Physical Sciences: Biology, Chemistry, Earth Science, and Physical Science
- Social Sciences and History: U.S. History—Comprehensive, World History and Geography, Economics, and World History—Overview
Number of Courses
The 984,359 virtual enrollments came from 1,086 different course titles, as determined by unique SCED codes.
Courses by Subject Area
English Language and Literature was, again, the subject area with the highest number of virtual enrollments (178,288)—18% of all virtual enrollments. In fact, since 2013-14, English Language and Literature has consistently been the highest enrollment subject area. Mathematics (17%), Social Sciences and History (16%), and Life and Physical Sciences (15%) were the next highest enrollment subject areas. In high-enrollment subject areas (with more than 75,000 virtual enrollments), virtual pass rates ranged from a low of 62% in Mathematics to a high of 66% in Social Sciences and History. See Table C1 and Table G6. Six of the 24 subject areas (Agriculture, Food, and Natural Resources; Engineering and Technology; Integrative Learning; Manufacturing; Nonsubject Specific; and Transportation, Distribution, and Logistics) had virtual pass rates that were equal to or greater than the non-virtual pass rates for these students. See Table C2. For comparison, in the years just prior to the pandemic, only one or two of the subject areas saw equal or better performance in the virtual courses.
Highest Virtual Enrollment Courses
For English Language and Literature, the most highly enrolled in virtual courses were 9th, 10th, 11th, and 12th grade English/Language Arts. Of those four, the pass rate was lowest for 9th grade English/Language Arts (48%). While the pass rate increased for each subsequent grade level, finishing at 67% for 12th grade English/Language Arts, the largest increase (9 percentage points) was between 9th and 10th grade English/Language Arts. The next three most highly enrolled English Language and Literature course titles were at the 6-8 grade level, followed by a multi-grade course and two in the K-5 level (grade 5 and grade 3). See Table C3.
Geometry, Algebra I, and Algebra II had the most Mathematics enrollments, each with over 27,000, followed by Consumer Mathematics with just over 11,000. Middle school Mathematics courses ranged from just under 6,000 to 8,500 enrollments. The pass rate across the top 10 most enrolled-in virtual Mathematics courses ranged from a low of 48% for Algebra I—Part 1 to a high of 76% in Consumer Mathematics. See Table C4.
Biology (33,218; 23%) and Chemistry (19,760; 13%) were the highest enrollment course titles, accounting for 10% or more of the virtual enrollments in Life and Physical Sciences courses. Two others—Earth Science and Physical Science—had more than 13,000 enrollments. Both Biology and Earth Science had the lowest pass rate (56%) of those in the top 10; the highest pass rate was 76% in Science (grade 5), followed by 71% in Physics. See Table C5.
In Social Sciences and History, three courses accounted for 10% or more of the virtual enrollments—U.S. History–Comprehensive (23,702; 15%), World History and Geography (17,327; 11%), and Economics (15,573; 10%). Two other titles had more than 10,000 enrollments: World History—Overview and U.S. Government—Comprehensive. Pass rates for the top 10 most-enrolled courses ranged from a low of 55% in both U.S. History—Comprehensive and World History and Geography to a high of 76% in Psychology. See Table C6.
Thirty-five AP courses were taken virtually in 2024-25. There were 5,652 virtual AP enrollments, up from around 4,900 enrollments the prior year. AP Psychology was the most popular course, accounting for 17% of the enrollments. The pass rate for AP courses taken virtually was 90%. See Table C7. The pass rate for non-virtual AP courses taken by virtual learners was 94%.
There were just over 3,000 students who took at least one AP course virtually. For close to half (48%) of these students, AP courses were the only virtual courses taken. Students whose only virtual courses were AP accounted for over 2,800 enrollments or about half of the virtual AP enrollments for the year. These students had a virtual pass rate of 93%, three percentage points higher than the state virtual AP pass rate. In addition, of the 931 schools with virtual enrollments in 9th, 10th, 11th, or 12th grade, 291 schools (31%) had virtual AP enrollments.
Subject Area Enrollments by Locale
Course enrollment patterns were quite consistent across locales. In fact, even in the four highest enrollment subject areas (English Language and Literature, Life and Physical Sciences, Mathematics, and Social Sciences and History), the difference in the percentage of virtual enrollments across the locales (Rural, Town, Suburb, and City) was within one to three percentage points. See Table C8.
However, pass rates in virtual courses varied across subject areas and locale. For instance, in Mathematics, the pass rates ranged from 58% (Rural and Town) and 61% (City) up to 68% (Suburban schools). These trends—Rural, Town, and City schools lagging behind and Suburban schools outperforming students in other locales—was also true for the other core subjects of English Language and Literature, Life and Physical Sciences, and Social Sciences and History, as well as across the totals for virtual enrollment pass rates by locale and subject area. See Table C9. Last year, only City and Rural schools followed the trend of the lowest-performing locale, indicating that the overall virtual pass rate for Town schools declined this year.
Subject Area Enrollments by Student Sex
Virtual enrollment patterns across subject areas were comparable for both male and female students. Across all 24 subject areas, the proportion of enrollments from males and females was the very same or within one percent of the other. Pass rates, however, showed more variability by student sex. In 16 of the 20 subject areas with reported pass rates for both sexes (including the four highest enrollment subject areas), females outperformed males—a trend that has been consistent in past years. Overall, females had a 67% virtual pass rate whereas males had a 64% pass rate. Notably, the virtual pass rate for both males and females increased by two points from last year (2023-24). See Table C10.
Looking more specifically at virtual AP enrollments and pass rate by sex for the 20 AP courses with available pass rate data (as previously mentioned and out of caution for confidentiality, pass rate data are not reported if there were fewer than 10 schools, fewer than 25 students, or fewer than 100 enrollments), there was some interesting variability. While the pass rates for males (89%) and females (91%) in these 20 AP courses with available pass rate data were very similar, the enrollment percentages by sex were very different: males accounted for 43% of enrollments, while females accounted for 57%. While females did indeed dominate enrollment in these AP courses, the opposite was true for seven courses in particular: AP Calculus AB, AP Calculus BC, AP Computer Science A, AP Macroeconomics, AP Microeconomics, AP Physics 1, and AP Physics C. Other than AP Statistics (females accounted for 63% of the enrollments compared to males at 37%), these more quantitative/math-driven AP courses were much more likely to be enrolled in by males. See Table C11.
Courses by Virtual Method
Schools classified virtual courses into one of three methods: Blended Learning, Digital Learning, or Online Learning. See pages 320 and 321 of the Michigan Student Data System Collection Details Manual: 2025-26 School Year.
- Blended Learning - A hybrid instructional delivery model where pupils are provided content, instruction, and assessment at a supervised educational facility where the pupil and teacher are in the same physical location and in part through internet-connected learning environments with some degree of pupil control over time, location, and pace of instruction. For a course to be considered blended, at least 30% of the course content is delivered online.
- Digital Learning - A course of study that is capable of generating a credit or a grade that is provided in an interactive internet-connected learning environment that does not contain an instructor within the online environment itself. There may be a teacher of record assigned to the course, but this teacher does not provide instruction to students through the online environment. For a course to be considered online as opposed to blended, all (or almost all) the course content is delivered online.
- Online Course - A course of study that is capable of generating a credit or a grade that is provided in an interactive internet-connected learning environment, where pupils are separated from their teachers by time, location, or both. For a course to be considered online as opposed to blended, all (or almost all) the course content is delivered online.
Blended Learning enrollments accounted for 5% of the virtual enrollments and had a pass rate of 66%. Digital Learning totaled 9% of the enrollments with a 59% pass rate. Online courses represented most of the enrollments (87%) and yielded a pass rate of 66%. Perhaps worth noting are the striking 1,221 schools (128,364 students) representing 853,916 online course enrollments as compared to the 192 schools (10,024 students) representing 46,559 blended learning enrollments. See Table C12.
Students
Fast Facts
- Over 150,000 K-12 students took at least one virtual course, which represented 11% of Michigan public school students.
- Elementary and middle school students each tended to reflect about 2% to 5% of students per grade; high school students reflected 13% to 28% per grade.
- 53% of virtual learners passed all their virtual courses. 16% of virtual learners did not pass any of their virtual courses.
- Of the almost 24,000 students who did not pass any of their virtual courses, 35% took only one or two courses. More than half of these students took and did not pass five or more virtual courses, and 15% took and did not pass 11 or more virtual courses.
- Female students had a slightly higher pass rate (67%) than did males (64%).
- Students in poverty made up the majority of virtual learners (61%) and virtual enrollments (69%). Students in poverty also had a lower pass rate (60% v. 77%).
- Part-time virtual learners had higher pass rates (67%) compared to full-time virtual learners (64%).
- Students using special education services made up 14% of the virtual learners.
- Pass rates were highest for students taking the fewest virtual courses. Students taking one to two virtual courses had a pass rate of 81% whereas those taking five or more had virtual pass rates of 63%.
- White students represented 62% of virtual students; African American or Black students were 19%.
- Over 813,000 virtual enrollments were from students whose districts were stable (all enrollments from the same district) throughout the year. These enrollments had a virtual pass rate of 71%.
By Grade Level
For the 2024-25 school year, 150,304 Michigan K-12 students, approximately 11% of students in the state, took at least one virtual course. This change represents approximately a 2% decrease from the total enrollment of the previous year. Seventy-six percent of virtual learners came from the high school grades. Each elementary and middle school grade level tended to be around 2% to 5% of the virtual learners with each of the high school grade levels between 13% to 28%. See Table D1.
By Student Sex
There were slightly more females (77,144) enrolled in virtual courses than males (73,187), though from a percentage perspective, each represented about half of the population. Females had a 3% higher pass rate (67% compared to males at 64%), continuing the trend seen in past years of females outperforming their male counterparts on this measure. See Table D2 and Table G7.
By Race/Ethnicity
White students represented 62% of virtual students, with African American or Black students totaling the second highest percentage with 19%. While African American or Black students represented 19% of virtual students, approximately 59% of schools enrolled at least one African American or Black student (93% of schools enrolled at least one White student). Asian students had the highest pass rate at 81%. See Table D3 and Table G8. These demographics are similar to the statewide K-12 demographics for 2024-25. See Student Enrollment Count Report.
By Poverty Status
Sixty-one percent of virtual learners were classified as living in poverty. This is a decrease of 8% compared to the prior year and approximately 11 percentage points higher than the percentage of K-12 students statewide who were economically disadvantaged. See Student Enrollment Count Report. Students living in poverty took 69% of the virtual enrollments for the year. When looking from a school-level perspective, 93% of Michigan schools enrolled at least one student in poverty in a virtual course. Comparatively, 88% of schools enrolled at least one student who was not in poverty in a virtual course. The pass rate for students in poverty (60%) was 17 percentage points lower than students who were not in poverty (77%). See Table D4 and Table G9. In 2023-24, the performance gap was 19 percentage points.
Prior to the pandemic, the data consistently showed that students in poverty performed better in their non-virtual courses. The 2020-21 and 2021-22 school years deviated from that pattern. In 2021-22, we saw that students in poverty had a higher pass rate in their virtual courses (64%) than they did in their non-virtual courses (62%). For the 2022-23 and 2023-24 years, this trend was reversed, and students in poverty did better in their non-virtual courses (65% compared to 58% for the 2023-24 year). This remained consistent for the 2024-25 year, with both students in poverty and those not performing better in their non-virtual courses. See Table D5.
Seventy-one percent of full-time virtual learners were in poverty compared to 56% of part-time virtual learners. The pass rate for full-time virtual learners in poverty was 60% compared to 59% for part-time virtual learners. See Table D6.
To get a sense of how the poverty level of schools might impact virtual learning patterns, we categorized schools into one of four categories based on the percentage of all learners at the school (not just virtual learners) that qualified for free or reduced-price (FRL) meals:
- Low FRL (<=25%)
- Mid-Low FRL (>25% to <=50%)
- Mid-High FRL (>50% to <=75%)
- High FRL (>75%)
About 8% of all Michigan K-12 students who attended Low FRL schools were virtual learners. Eight percent of the state’s students in Mid-Low FRL, and 13% of those in Mid-High FRL schools were virtual learners. Sixteen percent of students in High FRL schools took virtual courses in the 2024-2025 school year. See Table D7. Although overall virtual enrollments have steadily decreased since pandemic highs, this trend has remained relatively stable. From 2020-21 through the current year, schools with higher percentages of students qualifying for FRL also saw higher percentages of virtual learners.
By Special Education Status
Students using special education services made up 14% of the virtual learners and 15% of the virtual enrollments. These percentages are similar to the statewide percentage of students using special education services (15%) for the 2024-25 school year. See the Student Enrollment Counts Report. Eighty percent of Michigan schools enrolled a Special Education student in a virtual course. Students using special education services had a virtual pass rate of 59% compared to 66% for those who did not. See Table D8 and Table G10.
Table D9 shows how virtual enrollments varied by a student's primary disability. Just over 7,800 students had "Specific Learning Disability" listed as their primary disability. This translated to 38% of the virtual learners receiving special education services. The second and third largest groups were students with Other Health Impairments (4,620) and Emotional Impairment (2,768). These groups represented 23% and 13%, respectively, of virtual learners receiving special education services. Students with Severe Multiple Impairment had the highest virtual pass rate at 73%.
Table D10 shows how the percentage of virtual learners using special education services by primary disability compares to the overall state rates. For instance, only about five percent of the states' students with an IEP have "Emotional Impairment" listed as their primary disability. However, 27% of those students ended up taking at least one virtual course in 2024-25. These two tables can assist in tracking how virtual learning is being used to target specific disabilities and how well performance follows.
By Home-School / Nonpublic Student Status
Table D11 shows virtual learning data for home-schooled and nonpublic students enrolling in a public school to augment their education. There were just over 7,500 such students, and this group of students generated over 34,000 virtual enrollments, which is relatively stable from the previous year. These students had a 93% virtual pass rate.
By Full-Time or Part-Time
Thirty-three percent of students (49,864) were enrolled in cyber or full-time virtual schools. Students in these schools accounted for 490,800 or 50% of the virtual enrollments for the year. The pass rate for full-time virtual students was 64%. Sixty-eight percent of virtual learning students were part-time virtual learners, taking some courses virtually to supplement their face-to-face schedule. This subset made up 50% of the virtual enrollments and had a pass rate of 66%. See Table D12. The 66% virtual pass rate was eight percentage points lower than the non-virtual pass rate for these students. See Table D13.
Another way to conceptualize full/part-time status is to look at the percentage of a student's enrollments that were delivered virtually. There were many students (67,385) who had 75% or more of their enrollments reported as being delivered virtually. Examination of pass rates showed that students who had fewer than 25% of their enrollments delivered virtually outperformed students in the other three quartile groups. See Table D14. Table D15 and Table D16 show how the percentage of students, enrollments, and pass rates changed for LEA schools and PSA schools, respectively.
By Mobility Status
For the fifth consecutive year, mobility data were included as part of the data set. The mobility variable included the following statuses: stable, incoming, or outgoing. According to MI School Data, a student is marked as stable if he or she is in the same school for all collections for the school year, incoming students are those who transferred any time after the fall count day, and mobile students were present for fall count day but not subsequent ones. Some of the enrollments did not include information on this variable and were listed in the data tables as "Missing." More information about this variable is available on the MI School Data Student Mobility page. Click on the About this Report down arrow on that page and then click About the Data to view definitions.
When it came to district stability, over 813,059 (83%) of the virtual enrollments were classified as stable. The pass rate for stable enrollments was 71%. Incoming enrollments to a district represented 7% of the virtual enrollments and had a pass rate of 56%. See Table D17.
When looking at mobility from a poverty perspective, we get a more nuanced picture. Eighty percent of virtual enrollments from students in poverty were stable compared to 90% for students who were not in poverty. The pass rate for stable, in poverty enrollments was 66%, but rose to 80% for stable, not in poverty enrollments. For incoming virtual enrollments, there was a five percentage point pass rate advantage for students who were not in poverty (55% v. 60%). See Table D18.
Looking at mobility from a locale perspective showed somewhat similar virtual enrollment percentages across geographies. Following the trend from the previous year, Rural schools had the lowest percentage of stable enrollments at 80%. Town schools were next at 82%, followed by City schools at 83%. Suburban schools reported 85% of their enrollments as stable. See Table D19. Virtual pass rates showed a similar pattern. Stable enrollments from Rural schools had a 68% pass rate whereas the pass rate was 75% for Suburban schools. The incoming pass rates tended to lag the stable pass rates regardless of the locale. See Table D20.
A final mobility dimension explored was how enrollment and performance varied across full-time and part-time virtual schools. Full-time virtual or cyber schools had a lower percentage of their virtual enrollments designated as stable compared to part-time (78% v. 87%). The full-time pass rate for stable enrollments also lagged that of students from part-time virtual programs (70% v. 71%). See Table D21.
By Non-Virtual Course Performance
Part-time virtual learners with at least three non-virtual courses were classified into one of three categories based on their success in those non-virtual courses. The three categories were:
- Passed all Non-Virtual Courses
- Did Not Pass 1 or 2 Non-Virtual Courses
- Did Not Pass 3 or More Non-Virtual Courses
In total, 81% of part-time virtual learners had at least three or more non-virtual enrollments. Of that group, 45% of students passed all their non-virtual courses, 18% did not pass one or two, and 36% did not pass three or more. There were clear differences in virtual pass rates between the three categories. Students passing all their non-virtual courses had an 85% virtual pass rate. Students who did not pass one or two non-virtual courses had a virtual pass rate of 72%, and those with the lowest non-virtual success had a virtual pass rate of only 50%. See Table D22.
By Virtual Course Performance
Fifty-three percent of virtual learners passed every virtual enrollment they took. This was one percentage point higher than the prior two years. Sixteen percent did not pass any of their virtual enrollments, and 31% passed some, but not all, of their virtual enrollments. Students who passed all their virtual courses were responsible for 39% of the virtual enrollments. Students with mixed success generated 48% of the enrollments, and students who did not pass any of their virtual courses accounted for 13% of the virtual enrollments. See Table D23.
For the students who did not pass any of their virtual courses, 35% only took one or two virtual courses. On the other hand, over 13,000 students did not pass five or more virtual courses, and close to 3,600 students did not pass 11 or more virtual courses. See Table D24 and Table G11. Further analysis of students failing all their 11 or more virtual courses showed 88% of these students had a single school report data for them. Close to 60% of these students came from full-time virtual programs. Almost 700 students used special education services (19%), and over 2,900 of these students (83%) were in poverty.
What Table G11 makes clear is that for students who do not pass any of their virtual enrollments, “withdrawns” were rampant. For the virtual enrollments from students who did not pass any of their virtual enrollments, 54% had a “Withdrawn” status (exited, failing, or passing), and another 17% were classified as “Incomplete.” For those taking 11 or more virtual courses, 55% had a “Withdrawn” status, and 18% were marked “Incomplete.” In each case, only 28% and 26% of the virtual enrollments, respectively, were actually classified as “Completed/Failed.” Please see the section on Pass Rate Calculations for more elaboration on the impact of such issues on pass rates.
By Virtual Usage
Continuing pre-pandemic trends, virtual learners had the highest pass rates when they took one or two virtual courses. Students taking one to two virtual courses had a pass rate of 81% compared to a pass rate of 75% for those taking three to four virtual courses and a pass rate of 63% for students taking five or more virtual courses. About 33% of students took one or two virtual courses; however, 55% were found to have taken five or more virtual courses during the year. See Table D25.
Table D26 shows pass rate by virtual method and virtual usage. Blended Learning students had the highest overall pass rate (81%) and specifically, those taking one to two virtual courses labeled as Blended Learning were the highest pass rates at 83%. Students enrolled in one to two Online Courses were also among the highest pass rates at 81%. For all three virtual usage methods, pass rates decreased the number of courses taken increased.
State Assessment
Fast Facts
- 45% of 11th grade virtual learners who took the SAT scored proficient in the Reading/Writing component. 19% tested proficient in Math.
- For 8th grade students, the percentages were 52 and 14, respectively.
- Higher proficiency rates on state assessments were seen with higher non-virtual performance and with students who were not in poverty.
- Higher percentages of part-time virtual learners reached levels of proficiency on state assessment measures than their full-time counterparts.
By Subject Area
State assessment data can be used to provide an independent measure of student performance. Based on SAT and M-STEP data from students in 11th grade, virtual learners showed lower percentages reaching proficiency on the Evidence-Based Reading and Writing (SAT), Mathematics (SAT), Science (M-STEP) and Social Studies (M-STEP) examinations than the statewide proficiency rates, a consistent trend. Forty-five percent of the 11th grade virtual learners tested proficient in Evidence-Based Reading and Writing, and 19% were proficient in Mathematics. For Science, 29% tested proficient whereas Social Studies had 34% of the virtual learners reach proficiency. See Table E1. The pattern was similar for those taking the 8th grade assessments. See Table E2.
By Non-Virtual Performance
As expected, the percentage of 8th and 11th grade virtual learners testing proficient on these state tests varied considerably when accounting for their non-virtual performance. For instance, students taking a minimum of three non-virtual courses and passing all of them had proficiency rates that exceeded the statewide average for each assessment. Students who did not pass one or two of their non-virtual courses and those not passing three or more of their non-virtual courses had much lower rates of proficiency. See Table E3 and Table E4.
By Poverty Status
Students in poverty consistently recorded proficiency rates that were considerably lower than those of their peers who were not in poverty. As examples, 31% of virtual learners in poverty scored proficient on the 11th grade Evidence-Based Reading and Writing exam compared to 61% for those who were not in poverty. For Mathematics, only 7% of 8th grade virtual learners in poverty scored proficient compared to 30% for those not in poverty. See Table E5 and Table E6.
By Full- or Part-Time Type
Both 8th and 11th grade students taking virtual courses in a part-time capacity had higher rates of proficiency on the assessments compared to full-time virtual learners. For some assessments, the gap was sizable. For instance, the difference was 15 percentage points for 11th grade Mathematics and 12 points for 8th grade Mathematics. See Table E7 and Table E8.
Maps
Berrien RESA, Alpena-Montmorency-Alcona ESD, and Gogebic-Ontonagon ISD had over 20% of students in their service areas take a virtual course in 2024-25. In total, there were 9 ISDs/RESA with 15% or more of the students taking virtual courses. An additional 15 ISDs/RESA had at least 10% and less than 15% of their students take a virtual course. Only one ISDs/RESAs, Manistee, had less than 5% of their students take at least one virtual course. See Figure 2. Table H1 also presents the information from the map in alternative table format.
Figure 2. 2024-25 Percentage of Students Who Took a Virtual Course (Non-Cyber) by ISD
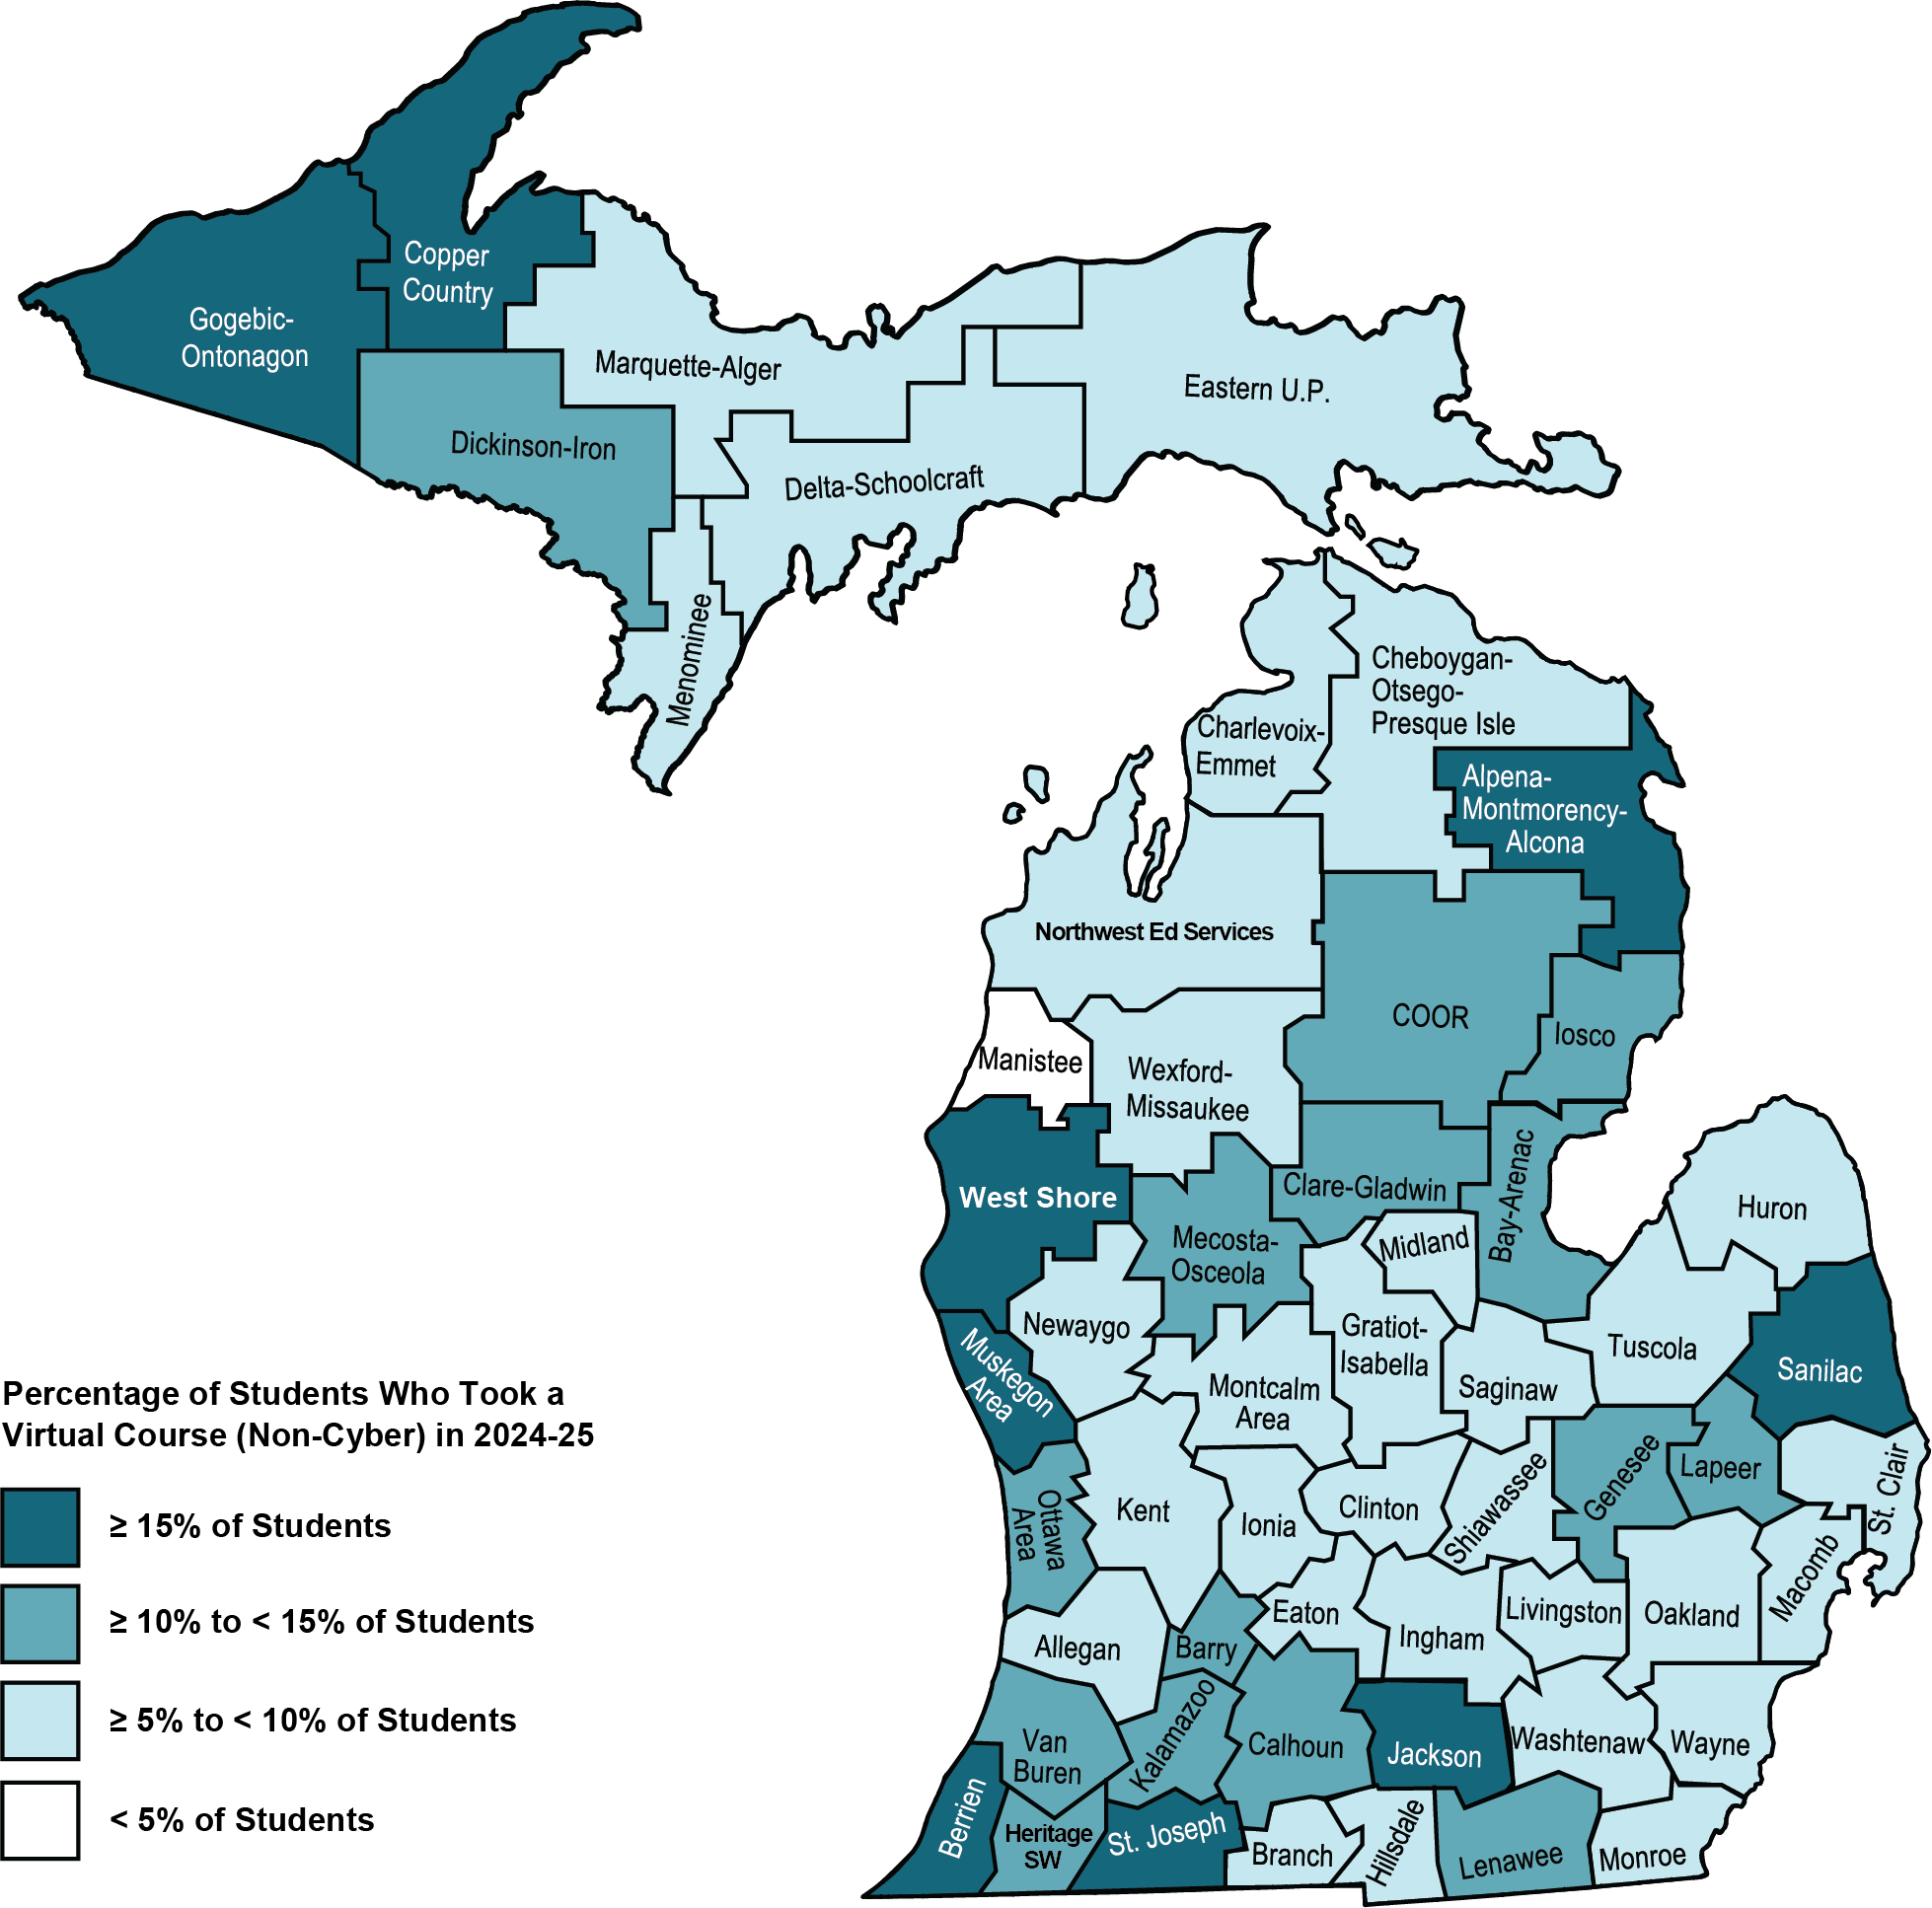
To put this map into some historical context, the first year we created this map was for the 2013-14 school year. That year, only two ISDs, Berrien and Mecosta-Osceola, had 3% or more.
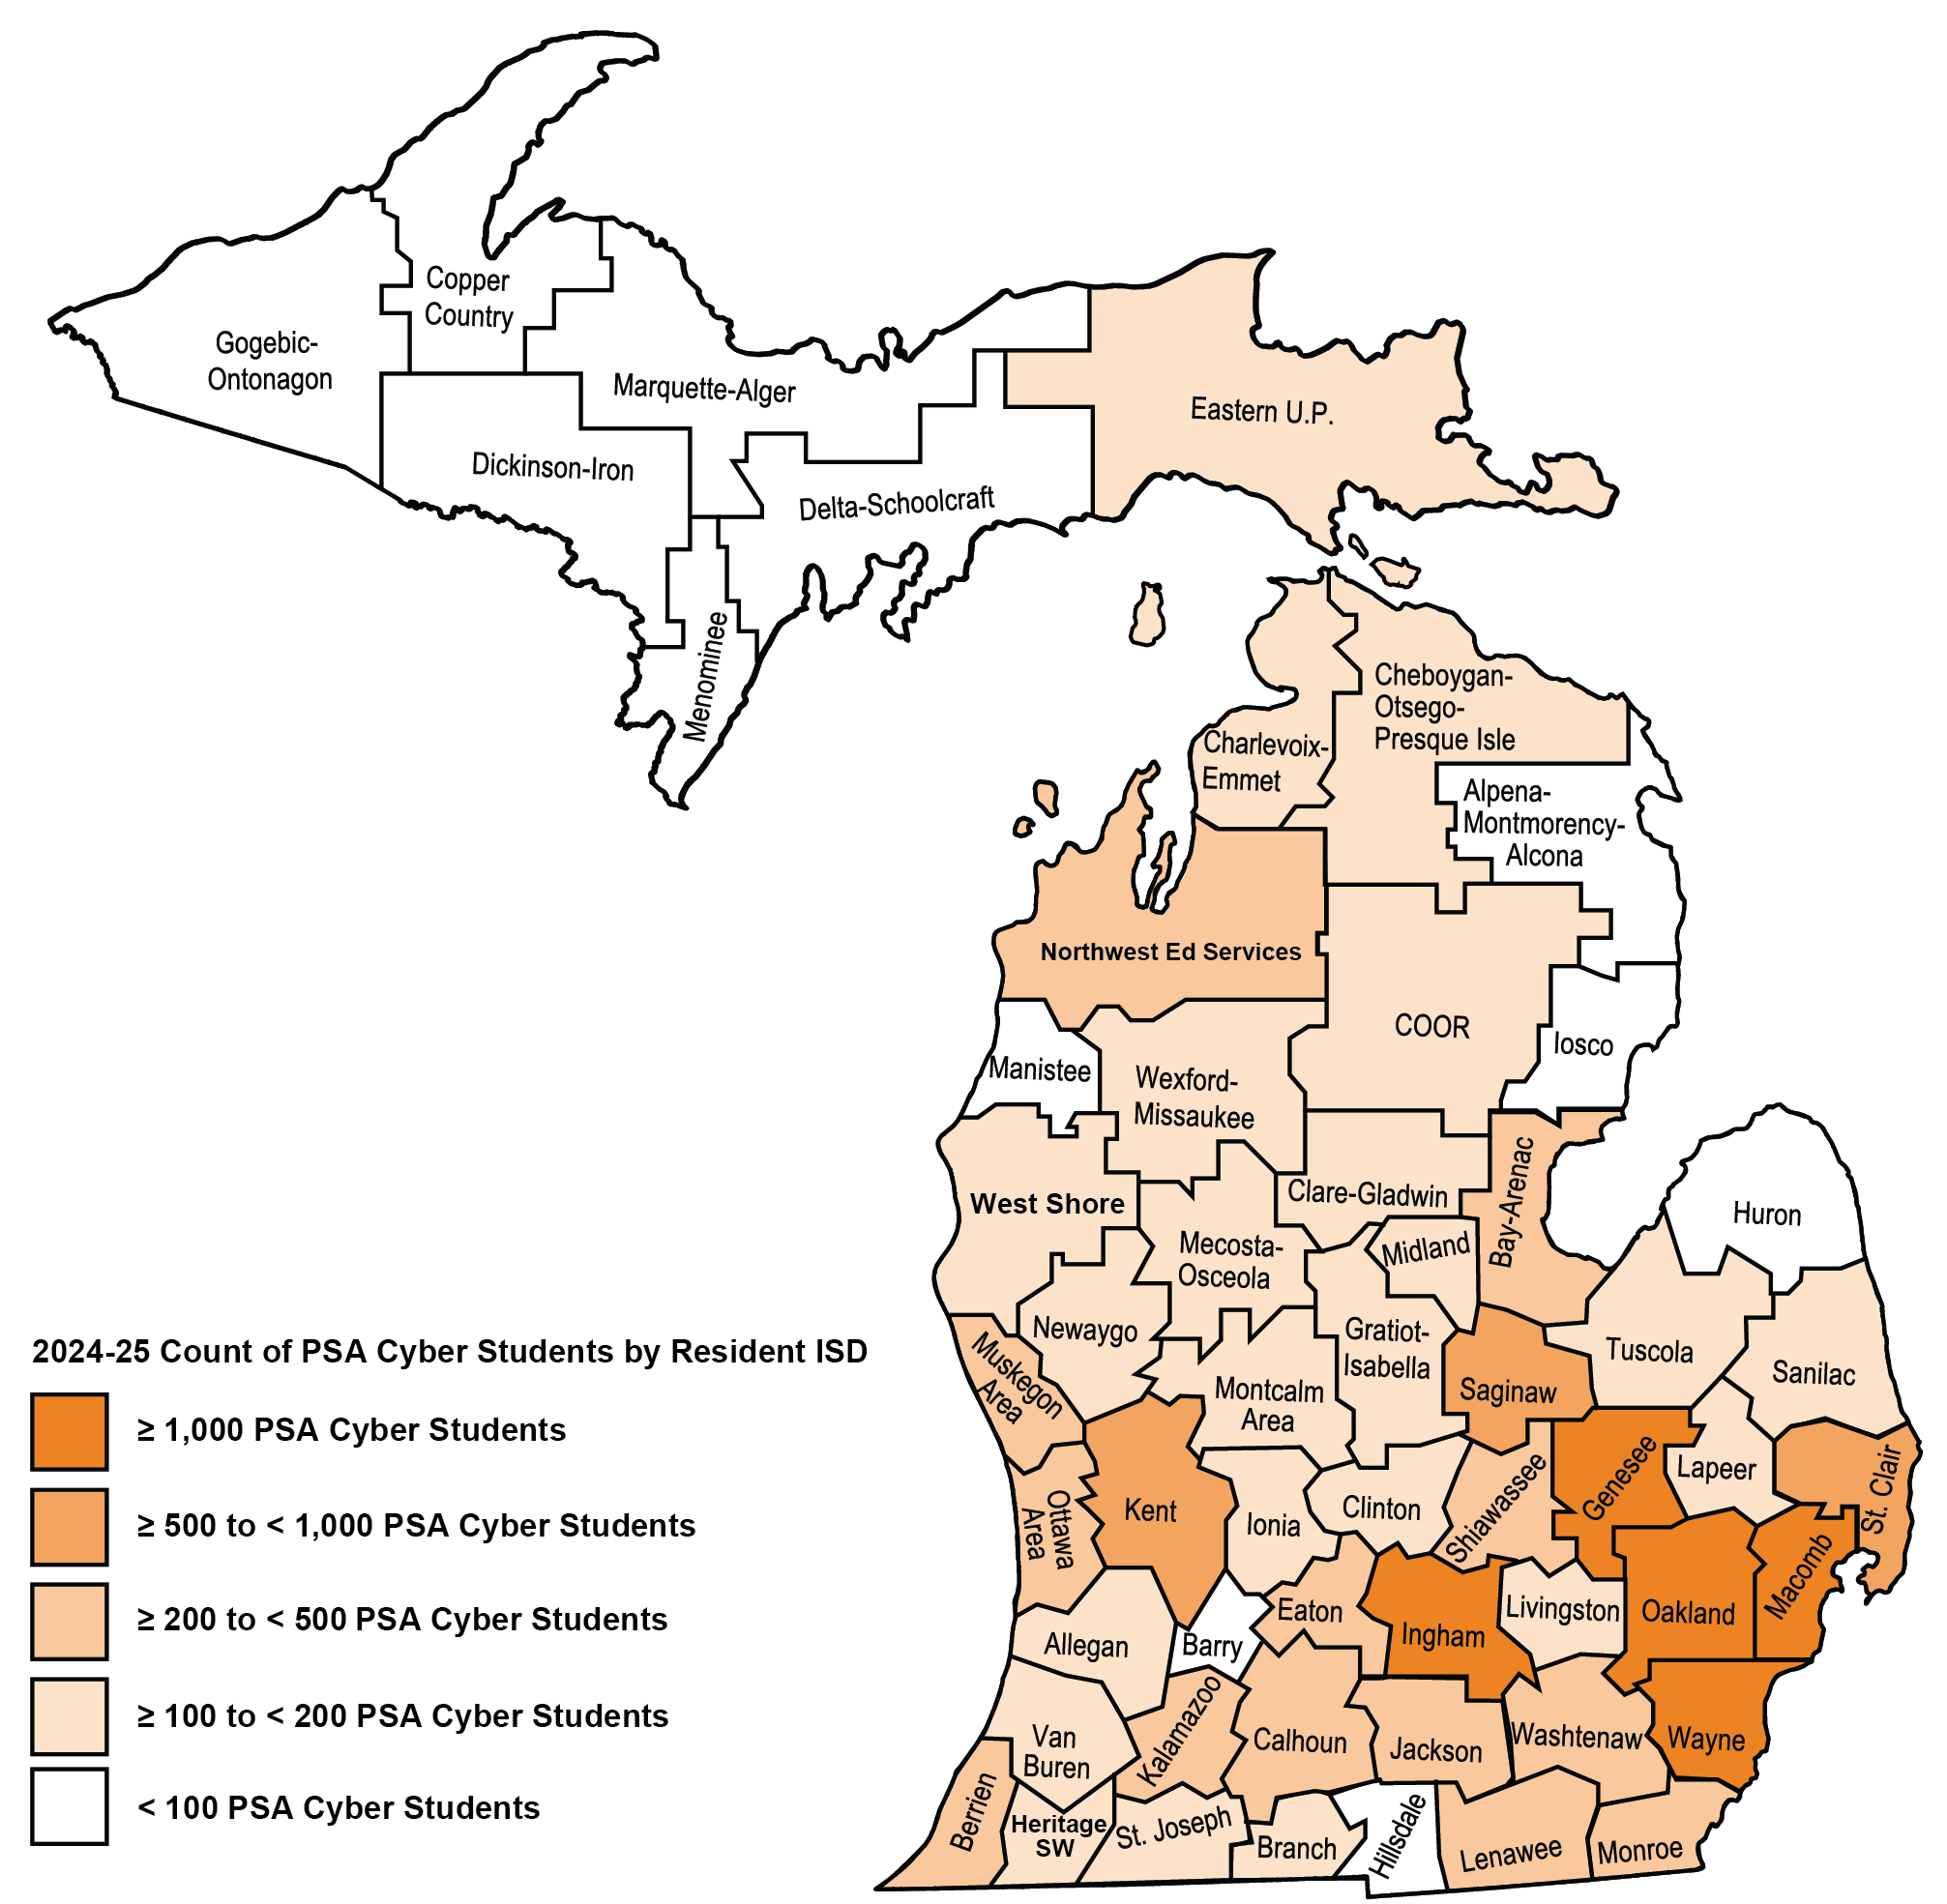
Over one in four students (over 5,500 students) attending a PSA cyber school resided within the Wayne RESA service area. The Genesee, Ingham, Macomb, and Oakland ISD service areas were the only other ISDs with 1,000 or more of their resident students attending PSA cyber schools. Forty-four of the 56 ISDs had 100 or more students attending a PSA cyber school. See Figure 3. Table H2 also presents the information from the map in alterative table format.
Figure 3. 2024-25 Count of PSA Cyber School Students by Resident ISD
Reflections on Higher Performing Schools
As the above sections of the report make clear, virtual learning performance, in general, has continued to produce mixed results. The analyses in this section will focus exclusively on those schools that achieved pass rates of 80% or higher to glean a clearer picture of what virtual learning looked like for these schools and programs and how it might have differed, if at all, from the state statistics.
There were 597 Michigan schools with virtual pass rates of 80% or higher, reflecting 44% of all schools in the state with virtual learners. These schools reported 57,910 virtual learners or about 39% of the state's virtual learners. When zooming in on these higher performing schools, the data show:
- Successful virtual programs can support various numbers of students, enrollments, and course offerings – These schools showed success with 10 or fewer students (33%) and 100 or more students (26%). See Table F1. Some offered few enrollments (106 schools had one to nine virtual enrollments) while others offered many (283 schools had 100 or more). See Table F2. They also varied in the number of course titles offered. Thirty-seven percent of these schools offered 10 or fewer virtual course titles. Twenty-five percent had enrollments between 26 and 50 courses, and 18% of these schools had students in more than 50 different virtual courses. See Table F3.
- LEA and PSA schools can offer successful virtual programs – Forty-five percent of LEA schools with virtual programs had schoolwide virtual pass rates of 80% or higher. For PSA schools, 31% achieved pass rates of 80% or higher. See Table F4. Both traditional school districts and charter districts can run successful virtual programs.
- Schools in cities, suburbs, towns, and rural settings are proving virtual learning success – All locales had schools with virtual pass rates of 80% or higher. Rural schools had almost half (47%) of their schools reach this threshold, and Suburban schools were close behind at 44%. See Table F5. These schools provide evidence of virtual learning success across the various geographies of the state.
- These schools show strong results across students of different races/ethnicities – These higher performing schools also showed promise for equitable outcomes for students of different races and ethnicities. The pass rates for African American or Black students (86%) and Hispanic or Latino (87%) were considerably closer to the White pass rate (90%) than they were across all schools. Asian students had the highest pass rate at 93%. See Table F6. For these schools, virtual programs appear to be approaching more equitable outcomes.
- Students in poverty are succeeding in these virtual programs – Recall that across the entire state, students in poverty had a pass rate (60%) that was 17 percentage points lower than that of virtual students who were not in poverty. In these 597 schools, the virtual pass rate for students in poverty rose to 86%---considerably closer to the 92% virtual pass rate for the students in those schools who were not in poverty. In these higher performing schools, students in poverty continued to represent a large percentage of virtual learners (44%) and virtual enrollments (53%), but those percentages were considerably smaller than the 61% of virtual learners and 69% of virtual enrollments seen across all virtual programs across the state. See Table F7. Additionally, virtual program success varied by a school’s free or reduced-lunch category (FRL). Seventy-one percent of Low FRL schools with virtual learners achieved virtual pass rates of 80% or higher. The percentage was 53% of the Mid-Low FRL schools, 35% of Mid-High FRL schools, and 25% of High FRL schools. See Table F8. While some High FRL schools showed it was possible, it was considerably rarer than it was for Low FRL schools.
- Both full- and part-time programs can run effective virtual programs, but success is rarer for full-time programs – Forty-five percent of part-time programs were able to yield schoolwide virtual pass rates of 80% or higher. It was considerably more difficult for full-time programs to achieve similar success. Only 17 of the 70 full-time programs (20%) reached the 80% pass rate mark. See Table F9.
- Both general education and alternative education programs reached 80% school-wide virtual pass rates – There were 543 general education schools in Michigan that achieved schoolwide virtual pass rates of 80% or higher. These schools represented 51% of general education schools with virtual programs. For alternative programs, 47 schools reached this mark. As a percentage of alternative programs, it represented just 17% of such schools, indicating that while it is possible, this threshold of success remains a sizable challenge. See Table F10.
- Virtual students can perform at or above their face-to-face performance level – In these 597 schools, there were 10,999 virtual learners who took a minimum of three virtual courses and had data for a minimum of three non-virtual courses. Eighty-three percent of these students had virtual pass rates that met or exceeded their non-virtual pass rates. See Table F11.
Conclusion
This year’s report represents the 15th year of data on the effectiveness of virtual learning in Michigan’s K-12 system. Many trends witnessed in past years continue to exist.
Table 1. Summary of Virtual Learning Metrics by School Year Since 2010-11
School Year | # of Virtual Students | # of Virtual Enrollments | # of Schools with Virtual Learners | Virtual Pass Rate |
|---|---|---|---|---|
2010-11 | 36,348 | 89,921 | 654 | 66% |
2011-12 | 52,219 | 153,583 | 850 | 62% |
2012-13 | 55,271 | 185,053 | 906 | 60% |
2013-14 | 76,122 | 319,630 | 1,007 | 57% |
2014-15 | 91,261 | 445,932 | 1,072 | 60% |
2015-16 | 90,878 | 453,570 | 1,026 | 58% |
2016-17 | 101,359 | 517,470 | 1,102 | 55% |
2017-18 | 112,688 | 581,911 | 1,158 | 55% |
2018-19 | 120,669 | 639,130 | 1,225 | 55% |
2019-20 | 121,900 | 672,682 | 1,225 | 56% |
2020-21 | 418,513 | 3,647,493 | 2,207 | 74% |
2021-22 | 208,460 | 1,408,763 | 1,914 | 69% |
2022-23 | 159,056 | 1,027,705 | 1,475 | 65% |
2023-24 | 154,087 | 1,019,661 | 1,421 | 63% |
2024-25 | 150,304 | 984,359 | 1,363 | 65% |
As Table 1 makes clear, the huge influx of virtual learners during the pandemic has now seemingly subsided, and levels seem to be more in line with pre-pandemic trends. Unfortunately, the reduction in virtual learners and enrollments has been accompanied by a nine percentage point drop in the virtual pass rate since 2020-21.
For the first time since the pandemic, we saw an increase in the virtual pass rate. This increase is driven by the higher performance of existing schools. There were 1,224 schools in the dataset that had virtual enrollments both this year and the prior year. These schools saw a slight decline in the number of virtual enrollments from 991,568 to 976,063, but a slight increase in the virtual pass rate from 63% to 65%. One hundred thirty-nine new schools were represented in this year’s data, while 197 schools from last year dropped out because they didn’t have any virtual learners this year. The new schools added a little more than 8,200 virtual enrollments, whereas the departing schools contributed over 28,000 last year. Interestingly, the new schools underperformed compared to the departing schools; new schools had a 59% pass rate this year, while the schools that left had a 73% pass rate the prior year. Obviously, the weight of virtual enrollments from schools in both years and their increased performance explain the year-over-year change.
We have also been tracking Alternative Education programs more closely since the pandemic. Prior to the pandemic, Alternative Education programs produced close to half the virtual enrollments. At the height of the pandemic, they dropped to just 10%. Since then, the percentage has been rebounding; this year, alternative education enrollments represented 40% of the virtual enrollments, the same as the prior year. The percentage of alternative enrollments is particularly important because the pass rate gap between Alternative Education programs and General Education programs is sizable. For this year, that performance gap was 19 percentage points lower for Alternative Education programs. However, that gap was two percentage points lower than the prior year.
We have also been paying closer attention to the grade levels of virtual learners. Pre-pandemic, we saw about 80% of the virtual enrollments come from the high school level. That percentage dropped to 40% for the 2020-21 school year. This year, the high school percentage was up to 72% of virtual enrollments, the same percentage as the prior year. With the K-5 pass rates at 79% and the 6-8th grade pass rate at 67%, enrollments at these levels tend to prop up the overall virtual pass rate. Therefore, if virtual enrollments continue to shift toward a larger percentage of high school enrollments, a slight decline in the overall pass rate is predictable.
With this year's positive trend in the virtual pass rate, we continue to be optimistic that the new floor for the virtual pass rate will be in the 60s rather than the 55% that was consistently observed prior to the pandemic.
The report also captured examples of schools and students benefiting from virtual learning. Thirty-nine percent of virtual learners attended schools that had virtual pass rates of 80% or higher, and equity of outcomes was much closer to the desired reality. Clearly, these schools add to the evidence that online learning can and does work for many schools and students. To date, however, these schools reflect more of the exception—the hope—rather than the rule. As school, community, and legislative leaders evaluate their virtual learning programs, the data provided in this report can serve as informative benchmarks, and the varied analyses can be used as models to understand local implementation success at a deeper level.
School leaders looking to take the next step forward with their virtual programs may find value in the many free resources that Michigan Virtual has authored. These resources include a series of practical guides to online learning designed for students, parents, teachers, mentors, school administrators, and school board members. Michigan Virtual also provides an online learning program self-assessment tool at no cost. There are also the National Standards for Quality Online Learning, which offer frameworks to evaluate online programs, online teaching, and online courses. Finally, educational leaders looking to communicate and collaborate with others around the future of learning may find value in the Future of Learning Council.
Appendix A - Methodology
Note: Click on the hyperlinked table number to return to the section of the report that discusses the table.
COVID-19 Impact
Readers should note that the COVID-19 pandemic appears to have significantly impacted data from 2019-20 through the 2022-23 reports. It may still be impacting this year’s data; caution is advised when comparing this year's findings with prior years.
About the Data
The data for this report came from the following sources:
- Michigan Student Data System – School Year 2024-2025;
- Educational Entity Master (EEM);
- Michigan Student Data System Teacher Student Data Link (TSDL) – Collection Year 2024-2025; and
- Michigan’s K-12 Virtual Learning Effectiveness Report, 2023-24 – Used for comparing this year’s data with the 2023-24 school year.
Because the data for this report incorporates a variety of sources, the findings within may differ from those found through the MI School Data portal, which may use different query parameters.
Enrollments classified as virtual in this report were treated as such due to the TSDL virtual method field indicating virtual delivery. Enrollments where the TSDL virtual method field was set to “Blended Learning,” “Digital Learning,” or “Online Course” were treated as virtual. According to the Michigan Student Data System Collection Details Manual, 2024-25 School Year, the virtual method field indicates "the type of virtual instruction the student is receiving.” (See page 320).
In prior years of the report, additional strategies, such as keyword searches of the local course title field, were used to flag virtual enrollments. Past years demonstrated that such efforts yield a low percentage of the virtual enrollments. This effort was discontinued starting with the 2020-21 report.
Michigan Virtual Students
Because this report is published by Michigan Virtual, some people have falsely concluded that the data in this report is about Michigan Virtual students only. Quite the contrary, the data in this report represent K-12 virtual learning across all providers, and Michigan Virtual as a provider would reflect only a small percentage of the virtual enrollments covered in this report. Readers interested in Michigan Virtual specific results can find those published in its Annual Report: 2024-25, which includes data on the number of students, districts, and enrollments served as well as its virtual pass rate.
Enrollment Calculations
Enrollment data for this report principally relies on data collected in the MSDS Student Course Component. See page 300 of the Michigan Student Data System Collection Details Manual, 2024-25 School Year for more details about this collection. Through this collection, the State collects data for each course a student takes. It is important to note some key variations in the data collection that impact possible approaches to calculating enrollment counts.
An example of known variation is the local naming conventions for course titles. For instance, one school may call a course “English 9”, another “9th Grade English,” and yet another “ELA 9.” The Student Course Component resolves this issue by requiring schools to report each enrollment with a Subject Area Code and a Course Identifier Code (SCED Course Code). These codes are created by the National Center for Education Statistics through the School Courses for the Exchange of Data (SCED) initiative. By using these standardized codes, we can compare data more readily across schools.
Another important variation involves course sections. In addition to the course title and SCED Course Code, schools frequently parse a course title into multiple sections. For example, a school with trimester courses may break a course into three sections, one for each trimester. A semester-based school, on the other hand, may break up a course into two sections. Others have chosen to break their courses into even smaller units, such as quarters, while others report what seem to be course units or lessons. Sometimes, schools use course sections to differentiate the online and face-to-face components of courses. For our purposes, the key point is that there is not always one enrollment record per student per course title.
Multiple course sections for a single course title are not, in and of themselves, problematic. They could be resolved if a weighting variable—for instance, the fraction of a Carnegie unit each section represents—was collected. The State does collect a field, Credits Granted, in the Student Course Component that might be used. However, two main drawbacks significantly impair its use. The first is that the field is only required for Migrant-eligible and dual-enrolled students. As such, many enrollments do not have a reported value. The second hindrance is inconsistent reporting of data that do exist. In some cases, schools report the Carnegie unit that was possible to be earned (same value no matter the completion status of the enrollment), although others treat the field value as variable depending on how well the student did (e.g., report a 0.5 for a student with a “Completed/Passed” completion status, but a 0.0 for a student who had a “Completed/Failed” completion status). These drawbacks make the Credits Granted field unusable as a weighting variable.
The challenge of variable course sections reported is multiplied when more than one school entity reports on the same pupil. The data appear to contain instances of two or more schools reporting on the same enrollments. Flavors of this appear to be a school partnering with an ISD to provide special education services and both reporting the same enrollments. Another example appears to occur when a student transfers from one district and then enrolls in the same courses at the new school. Table A1 and Table A2 highlight enrollment variation.
Table A1. 2024-25 Virtual Enrollment Counts and Pass Rates by Number of Virtual Enrollments Per Student/SCED Code Pair
# of Virtual Enrolls per Student/SCED Code Pair | # of Enrolls | % of Enrolls | Pass Rate |
|---|---|---|---|
1 | 438,157 | 45% | 65% |
2 | 437,692 | 44% | 67% |
3 | 59,139 | 6% | 52% |
4 | 26,152 | 3% | 42% |
5 | 3,710 | 0% | 45% |
6 or More | 19,509 | 2% | 83% |
Total | 984,359 | 100% | 65% |
Table A2. 2024-25 Percentage of Students by Total Student Enrollment Counts (Virtual and Non-Virtual) and Full- or Part-Time Schools
Enrollment Count (Virtual and Non-Virtual) | Full-Time | Part-Time |
|---|---|---|
1 to 5 | 8% | 8% |
6 to 10 | 27% | 21% |
11 to 15 | 47% | 43% |
16 to 20 | 12% | 19% |
21+ | 6% | 10% |
Total | 100% | 100% |
Given these data limitations, enrollment counts and related data figures in this report should be treated as estimates that, generally speaking, convey the trends observed for the school year.
Pass Rate Calculations
For this report, the pass rate was calculated based on data reported in the “Completion Status” field. For more information about the Completion Status field, including definitions for each status, see page 316 of the Michigan Student Data System Collection Details Manual, 2024-25 School Year. Column one of Table A3 displays the various statuses reported by schools for the virtual enrollments.
Table A3. 2024-25 Number and Percentage of Virtual Enrollments by Completion Status
Completion Status | # of Enrolls | % of Enrolls |
|---|---|---|
Audited | 1,033 | 0% |
Completed/Failed | 128,918 | 13% |
Completed/Passed | 641,569 | 65% |
Incomplete | 75,860 | 8% |
Ongoing Enrolled | 52 | 0% |
Tested Out | 74 | 0% |
Withdrawn/Exited | 85,910 | 9% |
Withdrawn/Failing | 16,536 | 2% |
Withdrawn/Passing | 34,407 | 3% |
Total | 984,359 | 100% |
Throughout this report, the pass rate simply represents the percentage of virtual enrollments with a status of “Completed/Passed.” Notice that the percentage of enrollments with a “Completed/Passed” status in Table A3 matches the statewide pass rate. This pass rate formula remains consistent with past reports.
Please keep in mind that calculating the pass rate in this manner will result in the lowest possible percentage. To illustrate why this is, consider the completion status of “Audited.” These virtual enrollments are not “failures” per se, but act as such in the formula since they are added to the formula's denominator without impacting the numerator. Another example is enrollments with a completion status of “Incomplete.” About 8% of the virtual enrollments in this report were classified as “Incomplete.” As such, they are treated in the report’s pass rate formula as zero passes, even though some may eventually be awarded a passing status. Finally, it is unclear how to best treat enrollments with a “Withdrawn” status. For instance, 3% of the virtual enrollments this year were marked as “Withdrawn/Passing,” meaning that the student was passing the course at the time the student was withdrawn. Should these enrollments be counted as failures? What about students whose enrollments were marked as “Withdrawn/Exited” (9% of the virtual enrollments)? Based on the data available, there is no way to determine whether that exiting occurred in the first few weeks of class or the final weeks of class. The data do not provide insight into whether the student was re-enrolled in a different course or whether it was too late for re-enrollment in a credit-bearing opportunity for the student.
The research team raises these issues because they represent questions for which there are no definitive answers. In the end, the team decided to report the pass rate as the percentage of all virtual enrollments that were reported as “Completed/Passed.” To provide readers with a better idea of the impact of this approach, additional data tables are provided in Appendix G that allow interested readers to draw their own conclusions and to calculate their own formulas for many of the pass rates reported.
Appendix B - School Tables
Click on the link below the table to return to the section of the report that discusses the table.
Table B1. Two-Year Comparison (2023-24 and 2024-25) of Virtual Enrollment Data with Pass Rates
School Years | # of Schools | % of 2024-25 Schools | # of 2024-25 Enrolls | % of 2024-25 Enrolls | 2024-25 |
|---|---|---|---|---|---|
2023-24 Only | 197 | NA | NA | NA | NA |
2024-25 Only | 139 | 10% | 8,296 | 1% | 59% |
Both Years | 1,224 | 90% | 976,063 | 99% | 65% |
Note: The 197 schools in the “2023-24 Only” row had 28,093 enrollments and a 73% pass rate for that year. The 1,224 schools in both years had a pass rate of 63% for 2023-24.
Back to discussion of Table B1
Table B2. Virtual Enrollment Differences for Schools Reporting Virtual Learners in Both 2023-24 and 2024-25
Year-to-Year Enroll Difference (2024-25 minus 2023-24) | # of Schools (Both Years) | % of Schools (Both Years) | # of Enrolls (Current Year) | % of Enrolls (Current Year) |
|---|---|---|---|---|
+1,000 or More | 18 | 1% | 197,635 | 20% |
+500 to +999 | 22 | 2% | 90,210 | 9% |
+100 to +499 | 167 | 14% | 182,319 | 19% |
0 to +99 | 405 | 33% | 90,818 | 9% |
-1 to -99 | 392 | 32% | 89,627 | 9% |
-100 to -499 | 182 | 15% | 130,278 | 13% |
-500 to -999 | 21 | 2% | 88,781 | 9% |
-1,000 or More | 17 | 1% | 106,395 | 11% |
Total | 1,224 | 100% | 976,063 | 100% |
Back to discussion of Table B2
Table B3. Virtual Pass Rate Differences for Schools Reporting Virtual Learners in Both 2023-24 and 2024-25
Year-to-Year Pass Rate Difference | # of Schools (Both Years) | % of Schools (Both Years) | # of Enrolls (Current Year) | % of Enrolls (Current Year) |
|---|---|---|---|---|
50 or More Percentage Points Increase | 9 | 1% | 3,203 | 0% |
25 to 49 Percentage Points Increase | 48 | 4% | 12,703 | 1% |
10 to 24 Percentage Points Increase | 171 | 14% | 212,645 | 22% |
0 to 9 Percentage Points Increase | 353 | 29% | 388,471 | 40% |
1 to 9 Percentage Points Decrease | 287 | 23% | 242,531 | 25% |
10 to 24 Percentage Points Decrease | 128 | 10% | 88,922 | 9% |
25 to 49 Percentage Points Decrease | 58 | 5% | 21,015 | 2% |
50 or More Percentage Points Decrease | 20 | 2% | 4,343 | 0% |
NA – < 10 Enrolls in One or Both Years | 150 | 12% | 2,230 | 0% |
Total | 1,224 | 100% | 976,063 | 100% |
Back to discussion of Table B3
Table B4. 2024-25 K-12 Virtual Enrollment Data by Grade Level
Grade Level | # of Schools | # of Enrolls | % of Enrolls | % Change | Pass Rate | % Change from Prior Year |
|---|---|---|---|---|---|---|
K | 96 | 16,279 | 2% | -10% | 79% | 2% |
1 | 105 | 18,964 | 2% | -12% | 81% | -1% |
2 | 113 | 20,776 | 2% | -2% | 81% | -1% |
3 | 117 | 21,702 | 2% | -1% | 77% | -1% |
4 | 122 | 20,992 | 2% | -3% | 78% | 1% |
5 | 148 | 24,359 | 2% | 0% | 77% | -3% |
6 | 254 | 37,860 | 4% | -14% | 72% | -2% |
7 | 357 | 49,549 | 5% | -10% | 68% | -4% |
8 | 451 | 61,497 | 6% | -7% | 64% | -2% |
9 | 768 | 141,965 | 14% | -1% | 50% | 5% |
10 | 834 | 154,357 | 16% | -4% | 59% | 4% |
11 | 877 | 167,952 | 17% | -2% | 65% | 3% |
12 | 885 | 248,107 | 25% | 0% | 69% | 3% |
Total | 1,363 | 984,359 | 100% | -3% | 65% | 2% |
Back to discussion of Table B4
Table B5. 2024-25 Pass Rate Comparison for Students in Their Virtual and Non-Virtual Courses by Grade Level
Grade Level | Virtual Pass Rate | Non-Virtual Pass Rate |
|---|---|---|
K | 79% | 50% |
1 | 81% | 65% |
2 | 81% | 59% |
3 | 77% | 59% |
4 | 78% | 56% |
5 | 77% | 53% |
6 | 72% | 65% |
7 | 68% | 59% |
8 | 64% | 60% |
9 | 50% | 64% |
10 | 59% | 72% |
11 | 65% | 79% |
12 | 69% | 86% |
Total | 65% | 75% |
Back to discussion of Table B5
Table B6. 2024-25 Number and Percentage of Schools and Virtual Enrollments by School Pass Rate
School Pass Rate | # of Schools | % of Schools | # of Enrolls | % of Enrolls |
|---|---|---|---|---|
0% to <10% | 89 | 7% | 24,140 | 2% |
10% to <20% | 25 | 2% | 6,661 | 1% |
20% to <30% | 34 | 2% | 48,350 | 5% |
30% to <40% | 61 | 4% | 89,736 | 9% |
40% to <50% | 68 | 5% | 43,208 | 4% |
50% to <60% | 98 | 7% | 97,245 | 10% |
60% to <70% | 170 | 12% | 168,727 | 17% |
70% to <80% | 213 | 16% | 213,526 | 22% |
80% to <90% | 241 | 18% | 166,473 | 17% |
90% to 100% | 364 | 27% | 126,293 | 13% |
Total | 1,363 | 100% | 984,359 | 100% |
Back to discussion of Table B6
Table B7. 2024-25 Number and Percentage of Schools and Virtual Enrollments by Entity Type
Entity Type | # of Schools | % of Schools | # of Enrolls | % of Enrolls |
|---|---|---|---|---|
ISD School | 26 | 2% | 9,832 | 1% |
ISD Unique Education Provider | NR | 0% | 423 | 0% |
LEA School | 1,201 | 88% | 576,286 | 59% |
LEA Unique Education Provider | 12 | 1% | 9,361 | 1% |
PSA School | 119 | 9% | 388,436 | 39% |
State School | NR | 0% | NR | 0% |
Total | 1,363 | 100% | 984,359 | 100% |
Note: Data are not reported (NR) out of caution for confidentiality.
Back to discussion of Table B7
Table B8. 2024-25 Number of Virtual Enrollments and Virtual Pass Rate by Entity Type
Entity Type | # of Enrolls | Pass Rate |
|---|---|---|
ISD School | 9,832 | 78% |
ISD Unique Education Provider | 423 | NR |
LEA School | 576,286 | 65% |
LEA Unique Education Provider | 9,361 | 94% |
PSA School | 388,436 | 64% |
State School | 21 | NR |
Total | 984,359 | 65% |
Note: Pass rate data are not reported (NR) if there were fewer than 10 schools, fewer than 25 students, or fewer than 100 enrollments.
Back to discussion of Table B8
Table B9. 2024-25 Number and Percentage of Full-Time (FT) Virtual or Cyber School by Entity Type
Entity Type | # of FT Schools | % of FT Schools |
|---|---|---|
ISD School | NR | NR |
LEA School | 49 | 70% |
LEA Unique Education Provider | NR | NR |
PSA School | 18 | 26% |
Total | 70 | 100% |
Note: Data are not reported (NR) out of caution for confidentiality.
Back to discussion of Table B9
Table B10. 2024-25 Number and Percentage of Students and Enrollments from Full-Time (FT) Virtual or Cyber Schools with Virtual Pass Rates by Entity Type
Entity Type | # of FT Students | % of FT Students | # of FT Enrolls | % of FT Enrolls | Pass Rate |
|---|---|---|---|---|---|
ISD School | 483 | 1% | 4,325 | 1% | NR |
LEA School | 19,516 | 39% | 176,303 | 36% | 59% |
LEA Unique Education Provider | 371 | 1% | 2,791 | 1% | NR |
PSA School | 29,682 | 60% | 307,381 | 63% | 67% |
Total | 49,864 | 100% | 490,800 | 100% | 64% |
Note: Pass rate data are not reported (NR) if there were fewer than 10 schools, fewer than 25 students, or fewer than 100 enrollments.
Back to discussion of Table B10
Table B11. 2024-25 Number and Percentage of Part-Time (PT) Virtual Schools by Entity Type
Entity Type | # of PT Schools | % of PT Schools |
|---|---|---|
ISD School | 25 | 2% |
ISD Unique Education Provider | 4 | 0% |
LEA School | 1,152 | 89% |
LEA Unique Education Provider | 10 | 1% |
PSA School | 101 | 8% |
State School | 1 | 0% |
Total | 1,293 | 100% |
Back to discussion of Table B11
Table B12. 2024-25 Number and Percentage of Students and Enrollments from Part-Time (PT) Virtual Schools with Virtual Pass Rates by Entity Type
Entity Type | # of PT Students | % of PT Students | # of PT Enrolls | % of PT Enrolls | Pass Rate |
|---|---|---|---|---|---|
ISD School | 1,269 | 1% | 5,507 | 1% | 80% |
ISD Unique Education Provider | 348 | 0% | 423 | 0% | NR |
LEA School | 89,390 | 88% | 399,983 | 81% | 68% |
LEA Unique Education Provider | 999 | 1% | 6,570 | 1% | 96% |
PSA School | 10,852 | 11% | 81,055 | 16% | 55% |
State School | NR | 0% | NR | 0% | NR |
Total | 102,020 | 100% | 493,559 | 100% | 66% |
Note: Because some students took courses across multiple entity types, a student may be counted toward more than one entity type. The total row reflects the number of unique students. Data are not reported (NR) out of caution for confidentiality. Pass rate data are not reported (NR) if there were fewer than 10 schools, fewer than 25 students, or fewer than 100 enrollments.
Back to discussion of Table B12
Table B13. 2024-25 Number and Percentage of Schools and Virtual Enrollments by School Emphasis
School Emphasis | # of Schools | % of Schools | # of Enrolls | % of Enrolls |
|---|---|---|---|---|
Alternative Education | 272 | 20% | 396,081 | 40% |
General Education | 1,069 | 78% | 586,498 | 60% |
Special Education, Vocational/CTE, or Reportable Program | 22 | 2% | 1,780 | 0% |
Total | 1,363 | 100% | 984,359 | 100% |
Back to discussion of Table B13
Table B14. 2024-25 Number of Virtual Enrollments and Virtual Pass Rate by School Emphasis
School Emphasis | # of Enrolls | Pass Rate |
|---|---|---|
Alternative Education | 396,081 | 54% |
General Education | 586,498 | 73% |
Special Education, Vocational/CTE, or Reportable Program | 1,780 | 67% |
Total | 984,359 | 65% |
Note: Pass rate data are not reported (NR) if there were fewer than 10 schools, fewer than 25 students, or fewer than 100 enrollments.
Back to discussion of Table B14
Table B15. 2024-25 Virtual Pass Rates for General Education and Alternative Education Schools by Entity Type
Entity Type | General Ed Pass Rate | Alternative Ed Pass Rate |
|---|---|---|
ISD School | NR | NR |
LEA School | 75% | 56% |
LEA Unique Education Provider | NR | NR |
PSA School | 70% | 42% |
Total | 73% | 54% |
Note: Pass rate data are not reported (NR) if there were fewer than 10 schools, fewer than 25 students, or fewer than 100 enrollments.
Back to discussion of Table B15
Table B16. 2024-25 Number and Percentage of Schools and Virtual Enrollments by Number of Virtual Enrollments per School
# of Virtual Enrolls per School | # of Schools | % of Schools | # of Enrolls | % of Enrolls |
|---|---|---|---|---|
1 to 9 | 166 | 12% | 765 | 0% |
10 to 19 | 114 | 8% | 1,594 | 0% |
20 to 29 | 69 | 5% | 1,626 | 0% |
30 to 39 | 44 | 3% | 1,494 | 0% |
40 to 49 | 39 | 3% | 1,736 | 0% |
50 to 59 | 43 | 3% | 2,341 | 0% |
60 to 69 | 35 | 3% | 2,248 | 0% |
70 to 79 | 31 | 2% | 2,314 | 0% |
80 to 89 | 30 | 2% | 2,552 | 0% |
90 to 99 | 15 | 1% | 1,413 | 0% |
100 or More | 777 | 57% | 966,276 | 98% |
Total | 1,363 | 100% | 984,359 | 100% |
Back to discussion of Table B16
Table B17. 2024-25 Percentage of Schools by Ratio of Virtual Courses to Student and School Pass Rate
School Pass Rate | 1 to 2 Virtual Courses per Student | 3 to 4 Virtual Courses per Student | 5 or More Virtual Courses per Student |
|---|---|---|---|
0% to <10% | 4% | 4% | 20% |
10% to <20% | 1% | 1% | 6% |
20% to <30% | 1% | 1% | 10% |
30% to <40% | 1% | 5% | 14% |
40% to <50% | 2% | 2% | 18% |
50% to <60% | 5% | 6% | 19% |
60% to <70% | 9% | 15% | 31% |
70% to <80% | 14% | 19% | 32% |
80% to <90% | 24% | 21% | 25% |
90% to 100% | 39% | 24% | 39% |
Total | 100% | 100% | 100% |
Back to discussion of Table B17
Table B18. 2024-25 Number and Percentage of Schools and Virtual Enrollments by Locale
Locale | # of Schools | % of Schools | # of Enrolls | % of Enrolls |
|---|---|---|---|---|
Rural | 471 | 35% | 310,597 | 32% |
Town | 196 | 14% | 121,158 | 12% |
Suburb | 482 | 35% | 382,090 | 39% |
City | 206 | 15% | 165,497 | 17% |
Not Specified | 8 | 1% | 5,017 | 1% |
Total | 1,363 | 100% | 984,359 | 100% |
Back to discussion of Table B18
Table B19. 2024-25 Percentage of Schools with Virtual Enrollments by Virtual Enrollment Totals and Locale
Locale | 1 to 24 Enrolls | 25 to 49 Enrolls | 50 to 74 Enrolls | 75 to 99 Enrolls | 100 or More Enrolls | Total |
|---|---|---|---|---|---|---|
Rural | 24% | 8% | 8% | 5% | 55% | 100% |
Town | 22% | 6% | 7% | 6% | 59% | 100% |
Suburb | 25% | 8% | 7% | 2% | 58% | 100% |
City | 24% | 9% | 4% | 5% | 58% | 100% |
Not Specified | 25% | 0% | 13% | 0% | 63% | 100% |
Back to discussion of Table B19
Table B20. 2024-25 Virtual Pass Rate by Locale
Locale | Pass Rate | % Change from 2023-24 |
|---|---|---|
Rural | 62% | -1% |
Town | 62% | -5% |
Suburb | 70% | 2% |
City | 61% | -1% |
Not Specified | NR | NR |
Total | 65% | 2% |
Note: Pass rate data are not reported (NR) if there were fewer than 10 schools, fewer than 25 students, or fewer than 100 enrollments.
Back to discussion of Table B20
Table B21. 2024-25 Percentage of Schools with Virtual Enrollments by Building Pass Rate and Locale
Locale | 0% to 20% Pass Rate | 20% to 40% Pass Rate | 40% to 60% Pass Rate | 60% to 80% Pass Rate | 80% to 100% Pass Rate | Total |
|---|---|---|---|---|---|---|
Rural | 5% | 7% | 12% | 30% | 47% | 100% |
Town | 8% | 6% | 12% | 31% | 42% | 100% |
Suburb | 8% | 6% | 13% | 29% | 44% | 100% |
City | 17% | 12% | 12% | 23% | 37% | 100% |
Not Specified | NR | NR | NR | NR | NR | 100% |
Total | 8% | 7% | 12% | 28% | 44% | 100% |
Note: Pass rate data are not reported (NR) if there were fewer than 10 schools, fewer than 25 students, or fewer than 100 enrollments.
Back to discussion of Table B21
Table B22. 2024-25 Number and Percentage of Schools with Virtual Enrollments by School Free or Reduced-Price Lunch Categories
Free or Reduced-Price Lunch Category | # of Schools with Virtual Students | # of MI Schools (All) | % of Schools with Virtual Learners |
|---|---|---|---|
Low FRL (<=25%) | 215 | 509 | 42% |
Mid-Low FRL (>25% to <=50%) | 400 | 956 | 42% |
Mid-High FRL (>50% to <=75%) | 458 | 1,047 | 44% |
High FRL (>75%) | 282 | 848 | 33% |
Missing | 8 | NA | NA |
Total | 1,363 | 3,360 | 41% |
Note: All Michigan K-12 schools with building codes were used to calculate the state figures. State data are available through MI School Data.
Back to discussion of Table B22
Table B23. 2024-25 Number and Percentage of Virtual Enrollments with Virtual Pass Rate by School Free or Reduced-Price Lunch Categories
Free or Reduced-Price Lunch Category | # of Enrolls | % of Enrolls | Pass Rate |
|---|---|---|---|
Low FRL (<=25%) | 85,401 | 9% | 86% |
Mid-Low FRL (>25% to <=50%) | 126,370 | 13% | 79% |
Mid-High FRL (>50% to <=75%) | 377,519 | 38% | 60% |
High FRL (>75%) | 391,504 | 40% | 61% |
Missing | 3,565 | 0% | NR |
Total | 984,359 | 100% | 65% |
Note: Pass rate data are not reported (NR) if there were fewer than 10 schools, fewer than 25 students, or fewer than 100 enrollments.
Back to discussion of Table B23
Table B24. 2024-25 Number of Schools, Students, and Enrolls for Schools with 1,000 or More Virtual Enrollments with Courses Per Student and Pass Rate by Entity Type
Entity Type | # of Schools | # of Students | # of Enrolls | Courses per Student | Pass Rate |
|---|---|---|---|---|---|
LEA School | 130 | 49,444 | 361,349 | 7.3 | 62% |
PSA School | 47 | 36,568 | 370,078 | 10.1 | 65% |
Other | 6 | 2,040 | 15,903 | 7.8 | NR |
Total | 183 | 87,354 | 747,330 | 8.6 | 64% |
Note: Pass rate data are not reported (NR) if there were fewer than 10 schools, fewer than 25 students, or fewer than 100 enrollments.
Back to discussion of Table B24
Table B25. 2024-25 Number of Schools, Students, and Enrolls for Schools with Less Than 1,000 Virtual Enrollments with Courses Per Student and Pass Rate by Entity Type
Entity Type | # of Schools | # of Students | # of Enrolls | Courses per Student | Pass Rate |
|---|---|---|---|---|---|
LEA School | 1,071 | 59,667 | 214,937 | 3.6 | 70% |
PSA School | 72 | 3,917 | 18,358 | 4.7 | 52% |
Other | 37 | 1,444 | 3,734 | 2.6 | 66% |
Total | 1,180 | 64,766 | 237,029 | 3.7 | 68% |
Back to discussion of Table B25
Table B26. 2024-25 Number of Schools, Students, and Enrolls for Schools with 1,000 or More Virtual Enrollments with Courses Per Student and Pass Rate by School Emphasis
School Emphasis | # of Schools | # of Students | # of Enrolls | Courses per Student | Pass Rate |
|---|---|---|---|---|---|
Alternative Education | 94 | 34,549 | 325,238 | 9.4 | 54% |
General Education | 89 | 53,374 | 422,092 | 7.9 | 72% |
Total | 183 | 87,354 | 747,330 | 8.6 | 64% |
Back to discussion of Table B26
Table B27. 2024-25 Number of Schools, Students, and Enrolls for Schools with Less Than 1,000 Virtual Enrollments with Courses Per Student and Pass Rate by School Emphasis
School Emphasis | # of Schools | # of Students | # of Enrolls | Courses per Student | Pass Rate |
|---|---|---|---|---|---|
Alternative Education | 178 | 10,937 | 70,843 | 6.5 | 53% |
General Education | 980 | 53,279 | 164,406 | 3.1 | 75% |
Other | 22 | 911 | 1,780 | 2.0 | 67% |
Total | 1,180 | 64,766 | 237,029 | 3.7 | 68% |
Back to discussion of Table B27
Appendix C - Course Tables
Click on the link below the table to return to the section of the report that discusses the table.
Table C1. 2024-25 Number of Schools, Virtual Students, and Virtual Enrollments with Percentage of Virtual Enrollments and Virtual Pass Rate by Subject Area
Subject Area | # of Schools | # of Students | # of Enrolls | % of Enrolls | Pass Rate |
|---|---|---|---|---|---|
Agriculture, Food, and Natural Resources | 153 | 991 | 1,188 | 0% | 87% |
Architecture and Construction | 88 | 324 | 473 | 0% | 75% |
Business and Marketing | 568 | 9,935 | 13,778 | 1% | 79% |
Communication and Audio/Visual Technology | 289 | 2,734 | 3,464 | 0% | 77% |
Engineering and Technology | 174 | 1,873 | 2,554 | 0% | 84% |
English Language and Literature | 1,192 | 88,244 | 178,288 | 18% | 63% |
Health Care Sciences | 370 | 3,222 | 3,989 | 0% | 81% |
Hospitality and Tourism | 139 | 1,023 | 1,300 | 0% | 70% |
Human Services | 394 | 7,507 | 9,310 | 1% | 74% |
Information Technology | 574 | 12,209 | 15,619 | 2% | 71% |
Integrative Learning | 20 | 1,647 | 3,008 | 0% | 94% |
Life and Physical Sciences | 1,178 | 81,280 | 147,531 | 15% | 64% |
Manufacturing | 39 | 183 | 406 | 0% | 93% |
Mathematics | 1,214 | 87,657 | 171,800 | 17% | 62% |
Military Science | 19 | 50 | NR | 0% | NR |
Miscellaneous | 815 | 32,104 | 64,670 | 7% | 70% |
Nonsubject Specific | 101 | 3,389 | 4,044 | 0% | 87% |
Physical, Health, and Safety Education | 1,005 | 48,649 | 76,461 | 8% | 65% |
Public, Protective, and Government Services | 261 | 1,596 | 1,869 | 0% | 83% |
Religious Education and Theology | 62 | 141 | 146 | 0% | 86% |
Social Sciences and History | 1,186 | 87,719 | 161,153 | 16% | 66% |
Transportation, Distribution, and Logistics | 24 | 78 | 100 | 0% | 88% |
Visual and Performing Arts | 907 | 46,179 | 70,649 | 7% | 66% |
World Languages | 902 | 31,232 | 52,503 | 5% | 61% |
Total | 1,363 | 150,304 | 984,359 | 100% | 65% |
Note: Because schools and students may have enrollments in multiple subject areas, row counts may not equal the total. The total row reflects the number of unique schools and students. Data are not reported (NR) out of caution for confidentiality. Pass rate data are not reported (NR) if there were fewer than 10 schools, fewer than 25 students, or fewer than 100 enrollments.
Back to discussion of Table C1
Table C2. 2024-25 Pass Rate Comparison for Students in Their Virtual and Non-Virtual Courses by Subject Area
Subject Area | Virtual Pass Rate | Non-Virtual Pass Rate | Difference (V–NV) |
|---|---|---|---|
Agriculture, Food, and Natural Resources | 87% | 81% | 5% |
Architecture and Construction | 75% | 82% | -7% |
Business and Marketing | 79% | 87% | -8% |
Communication and Audio/Visual Technology | 77% | 86% | -9% |
Engineering and Technology | 84% | 78% | 6% |
English Language and Literature | 63% | 74% | -11% |
Health Care Sciences | 81% | 84% | -3% |
Hospitality and Tourism | 70% | 79% | -9% |
Human Services | 74% | 82% | -8% |
Information Technology | 71% | 75% | -3% |
Integrative Learning | 94% | 81% | 13% |
Life and Physical Sciences | 64% | 73% | -9% |
Manufacturing | 93% | 82% | 11% |
Mathematics | 62% | 70% | -8% |
Military Science | NR | 79% | NR |
Miscellaneous | 70% | 74% | -4% |
Nonsubject Specific | 87% | 53% | 35% |
Physical, Health, and Safety Education | 65% | 75% | -10% |
Public, Protective, and Government Services | 83% | 84% | -1% |
Religious Education and Theology | 86% | NR | NR |
Social Sciences and History | 66% | 73% | -7% |
Transportation, Distribution, and Logistics | 88% | 84% | 4% |
Visual and Performing Arts | 66% | 80% | -13% |
World Languages | 61% | 76% | -15% |
Total | 65% | 74% | -9% |
Note: Pass rate data are not reported (NR) if there were fewer than 10 schools, fewer than 25 students, or fewer than 100 enrollments.
Back to discussion of Table C2
Table C3. 2024-25 Number of Schools, Virtual Students, and Virtual Enrollments with Percentage of Virtual Enrollments and Virtual Pass Rate by Course Title for the Top 10 Most Enrolled in English Language and Literature Courses
English Language and Literature Course Titles | # of Schools | # of Students | # of Enrolls | % of Enrolls | Pass Rate |
|---|---|---|---|---|---|
English/Language Arts I (9th grade) | 711 | 19,430 | 30,092 | 17% | 48% |
English/Language Arts II (10th grade) | 681 | 18,702 | 28,991 | 16% | 57% |
English/Language Arts III (11th grade) | 658 | 16,823 | 27,153 | 15% | 64% |
English/Language Arts IV (12th grade) | 633 | 14,119 | 24,738 | 14% | 67% |
Language Arts (grade 8) | 312 | 5,312 | 9,070 | 5% | 62% |
Language Arts (grade 7) | 269 | 4,221 | 7,170 | 4% | 66% |
Language Arts (grade 6) | 182 | 3,052 | 5,152 | 3% | 69% |
Language Arts—General | 44 | 2,103 | 3,465 | 2% | 66% |
Language Arts (grade 5) | 94 | 2,137 | 3,070 | 2% | 73% |
Language Arts (grade 3) | 78 | 1,968 | 2,747 | 2% | 73% |
Total | 1,074 | 72,043 | 141,648 | 79% | 60% |
Note: Because schools and students may have enrollments in multiple course titles, row counts may not equal the total. The total row reflects the number of unique schools and students. Percentage of enrollments is based on the overall total of 178,288 for this subject area.
Back to discussion of Table C3
Table C4. 2024-25 Number of Schools, Virtual Students, and Virtual Enrollments with Percentage of Virtual Enrollments and Virtual Pass Rate by Course Title for the Top 10 Most Enrolled in Mathematics Courses
Mathematics Course Titles | # of Schools | # of Students | # of Enrolls | % of Enrolls | Pass Rate |
|---|---|---|---|---|---|
Geometry | 730 | 20,540 | 32,767 | 19% | 58% |
Algebra I | 651 | 18,242 | 28,360 | 17% | 50% |
Algebra II | 687 | 16,997 | 27,225 | 16% | 66% |
Consumer Mathematics | 414 | 7,445 | 11,056 | 6% | 76% |
Mathematics (grade 8) | 278 | 4,964 | 8,518 | 5% | 58% |
Mathematics (grade 7) | 292 | 4,861 | 8,115 | 5% | 66% |
Mathematics (grade 6) | 212 | 3,509 | 5,973 | 3% | 70% |
Business Mathematics | 174 | 2,882 | 4,560 | 3% | 56% |
Algebra I—Part 1 | 153 | 3,227 | 4,223 | 2% | 48% |
Mathematics—Other | 178 | 2,580 | 4,215 | 2% | 60% |
Total | 1,061 | 68,255 | 135,012 | 79% | 60% |
Note: Because schools and students may have enrollments in multiple course titles, row counts may not equal the total. The total row reflects the number of unique schools and students. Percentage of enrollments is based on the overall total of 171,800 for this subject area.
Back to discussion of Table C4
Table C5. 2024-25 Number of Schools, Virtual Students, and Virtual Enrollments with Percentage of Virtual Enrollments and Virtual Pass Rate by Course Title for the Top 10 Most Enrolled in Life and Physical Sciences Courses
Life and Physical Sciences Course Titles | # of Schools | # of Students | # of Enrolls | % of Enrolls | Pass Rate |
|---|---|---|---|---|---|
Biology | 731 | 21,382 | 33,218 | 23% | 56% |
Chemistry | 580 | 12,682 | 19,760 | 13% | 63% |
Earth Science | 353 | 8,766 | 13,879 | 9% | 56% |
Physical Science | 339 | 8,405 | 13,296 | 9% | 60% |
Earth and Space Science | 252 | 5,637 | 8,379 | 6% | 60% |
Environmental Science | 376 | 4,569 | 6,918 | 5% | 59% |
Science (grade 7) | 248 | 3,345 | 5,476 | 4% | 67% |
Science (grade 8) | 267 | 3,359 | 5,354 | 4% | 66% |
Physics | 369 | 3,548 | 5,081 | 3% | 71% |
Science (grade 5) | 106 | 2,494 | 3,336 | 2% | 76% |
Total | 1,041 | 62,310 | 114,697 | 78% | 60% |
Note: Because schools and students may have enrollments in multiple course titles, row counts may not equal the total. The total row reflects the number of unique schools and students. Percentage of enrollments is based on the overall total of 147,531 for this subject area.
Back to discussion of Table C5
Table C6. 2024-25 Number of Schools, Virtual Students, and Virtual Enrollments with Percentage of Virtual Enrollments and Virtual Pass Rate by Course Title for the Top 10 Most Enrolled in Social Sciences and History Courses
Social Sciences and History Course Titles | # of Schools | # of Students | # of Enrolls | % of Enrolls | Pass Rate |
|---|---|---|---|---|---|
U.S. History—Comprehensive | 538 | 15,573 | 23,702 | 15% | 55% |
World History and Geography | 440 | 11,225 | 17,327 | 11% | 55% |
Economics | 665 | 14,149 | 15,573 | 10% | 67% |
World History—Overview | 347 | 8,566 | 13,050 | 8% | 63% |
U.S. Government—Comprehensive | 393 | 9,406 | 10,366 | 6% | 68% |
Social Studies (grade 8) | 237 | 4,589 | 7,921 | 5% | 64% |
Psychology | 455 | 5,073 | 6,204 | 4% | 76% |
Social Studies (grade 7) | 201 | 3,487 | 5,858 | 4% | 71% |
Civics | 358 | 5,016 | 5,664 | 4% | 60% |
Modern U.S. History | 188 | 3,775 | 5,634 | 3% | 63% |
Total | 1,002 | 61,766 | 111,299 | 69% | 62% |
Note: Because schools and students may have enrollments in multiple course titles, row counts may not equal the total. The total row reflects the number of unique schools and students. Percentage of enrollments is based on the overall total of 161,153 for this subject area.
Back to discussion of Table C6
Table C7. 2024-25 Number of Schools, Virtual Students, and Virtual Enrollments with Percentage of Virtual Enrollments and Virtual Pass Rate for AP Courses
AP Course Title | # of Schools | # of Students | # of Enrolls | % of Enrolls | Pass Rate |
|---|---|---|---|---|---|
AP 2-D Art and Design | NR | NR | NR | NR | NR |
AP African American Studies | NR | NR | NR | NR | NR |
AP Art History | 34 | 173 | 201 | 4% | 81% |
AP Biology | 76 | 136 | 221 | 4% | 89% |
AP Calculus AB | 63 | 124 | 195 | 3% | 89% |
AP Calculus BC | 38 | 102 | 206 | 4% | 95% |
AP Chemistry | 34 | 88 | 140 | 2% | 85% |
AP Chinese Language and Culture | NR | NR | NR | NR | NR |
AP Comparative Government and Politics | NR | NR | NR | NR | NR |
AP Computer Science A | 82 | 204 | 345 | 6% | 90% |
AP Computer Science Principles | 30 | 64 | NR | NR | NR |
AP Drawing | NR | NR | NR | NR | NR |
AP Economics | NR | NR | NR | NR | NR |
AP English Language and Composition | 70 | 229 | 371 | 7% | 84% |
AP English Literature and Composition | 84 | 146 | 246 | 4% | 95% |
AP Environmental Science | 53 | 115 | 195 | 3% | 94% |
AP European History | 28 | 39 | NR | NR | NR |
AP French Language and Culture | NR | NR | NR | NR | NR |
AP Government | 25 | 76 | NR | NR | NR |
AP Human Geography | 42 | 86 | 143 | 3% | 94% |
AP Macroeconomics | 84 | 301 | 308 | 5% | 95% |
AP Microeconomics | 81 | 322 | 338 | 6% | 91% |
AP Music Theory | NR | NR | NR | NR | NR |
AP Physics 1 | 35 | 72 | 123 | 2% | 89% |
AP Physics 2 | NR | NR | NR | NR | NR |
AP Physics C | 29 | 71 | 136 | 2% | 96% |
AP Physics C: Mechanics | NR | NR | NR | NR | NR |
AP Precalculus | NR | NR | NR | NR | NR |
AP Psychology | 116 | 531 | 944 | 17% | 91% |
AP Spanish Language and Culture | 35 | 74 | 126 | 2% | 82% |
AP Spanish Literature and Culture | NR | NR | NR | NR | NR |
AP Statistics | 82 | 216 | 373 | 7% | 93% |
AP U.S. Government and Politics | 61 | 174 | 184 | 3% | 90% |
AP U.S. History | 64 | 121 | 197 | 3% | 89% |
AP World History: Modern | 47 | 176 | 263 | 5% | 87% |
Total | 294 | 3,031 | 5,652 | 100% | 90% |
Note: Additional enrollments were labeled as Advanced Placement but did not match an AP SCED code, and some local course titles included “AP” without an AP SCED code. As a result, these data likely underreport virtual AP participation. Because schools and students may have enrollments in multiple course titles, row counts may not equal the total. The total row reflects the number of unique schools and students. Data are not reported (NR) out of caution for confidentiality. Pass rate data are not reported (NR) if there were fewer than 10 schools, fewer than 25 students, or fewer than 100 enrollments.
Back to discussion of Table C7
Table C8. 2024-25 Virtual Enrollments Percentage by Locale and Subject Area
Subject Area | % Rural | % Town | % Suburb | % City | % Not Specified |
|---|---|---|---|---|---|
Agriculture, Food, and Natural Resources | 0% | 0% | 0% | 0% | 0% |
Architecture and Construction | 0% | 0% | 0% | 0% | 0% |
Business and Marketing | 1% | 2% | 2% | 1% | 0% |
Communication and Audio/Visual Technology | 0% | 0% | 1% | 0% | 0% |
Engineering and Technology | 0% | 0% | 0% | 0% | 0% |
English Language and Literature | 18% | 18% | 18% | 17% | 18% |
Health Care Sciences | 0% | 1% | 0% | 0% | 1% |
Hospitality and Tourism | 0% | 0% | 0% | 0% | 0% |
Human Services | 1% | 1% | 1% | 1% | 0% |
Information Technology | 1% | 2% | 2% | 3% | 2% |
Integrative Learning | 0% | 0% | 1% | 0% | 0% |
Life and Physical Sciences | 15% | 14% | 15% | 17% | 11% |
Manufacturing | 0% | 0% | 0% | 0% | 0% |
Mathematics | 17% | 17% | 17% | 19% | 14% |
Military Science | 0% | 0% | 0% | 0% | 0% |
Miscellaneous | 5% | 5% | 8% | 7% | 7% |
Nonsubject Specific | 0% | 0% | 0% | 1% | 0% |
Physical, Health, and Safety Education | 10% | 9% | 6% | 7% | 12% |
Public, Protective, and Government Services | 0% | 0% | 0% | 0% | 0% |
Religious Education and Theology | 0% | 0% | 0% | 0% | 0% |
Social Sciences and History | 17% | 17% | 16% | 16% | 21% |
Transportation, Distribution, and Logistics | 0% | 0% | 0% | 0% | 0% |
Visual and Performing Arts | 8% | 9% | 6% | 8% | 11% |
World Languages | 5% | 5% | 6% | 5% | 2% |
Total | 100% | 100% | 100% | 100% | 100% |
Back to discussion of Table C8
Table C9. 2024-25 Virtual Enrollment Pass Rates by Locale and Subject Area
Subject Area | Rural Pass Rate | Town Pass Rate | Suburban Pass Rate | City Pass Rate | Not Specified Pass Rate |
|---|---|---|---|---|---|
Agriculture, Food, and Natural Resources | 84% | 91% | 87% | NR | NR |
Architecture and Construction | 86% | 68% | NR | NR | NR |
Business and Marketing | 80% | 77% | 80% | 67% | NR |
Communication and Audio/Visual Technology | 81% | 75% | 78% | 67% | NR |
Engineering and Technology | 84% | 75% | 87% | 83% | NR |
English Language and Literature | 59% | 61% | 68% | 61% | NR |
Health Care Sciences | 77% | 81% | 85% | 76% | NR |
Hospitality and Tourism | 75% | 58% | 79% | 52% | NR |
Human Services | 68% | 77% | 76% | 70% | NR |
Information Technology | 72% | 61% | 72% | 75% | NR |
Integrative Learning | NR | NR | 94% | NR | NR |
Life and Physical Sciences | 60% | 61% | 69% | 62% | NR |
Manufacturing | 93% | NR | NR | NR | NR |
Mathematics | 58% | 58% | 68% | 61% | NR |
Military Science | NR | NR | NR | NR | NR |
Miscellaneous | 68% | 57% | 80% | 48% | NR |
Nonsubject Specific | 85% | 70% | 86% | NR | NR |
Physical, Health, and Safety Education | 69% | 50% | 68% | 64% | NR |
Public, Protective, and Government Services | 79% | 83% | 85% | 86% | NR |
Religious Education and Theology | NR | NR | NR | NR | NR |
Social Sciences and History | 62% | 67% | 70% | 61% | NR |
Transportation, Distribution, and Logistics | NR | NR | NR | NR | NR |
Visual and Performing Arts | 63% | 68% | 68% | 68% | NR |
World Languages | 56% | 68% | 66% | 51% | NR |
Total | 62% | 62% | 70% | 61% | NR |
Note: Pass Rate data are not reported (NR) if there were fewer than 10 schools, fewer than 25 students, or fewer than 100 enrollments.
Back to discussion of Table C9
Table C10. 2024-25 Number and Percentage of Virtual Enrollments with Pass Rates by Student Sex and Subject Area
Subject Area | # of Female Enrolls | # of Male Enrolls | % of Female Enrolls | % of Male Enrolls | Female Pass Rate | Male Pass Rate |
|---|---|---|---|---|---|---|
Agriculture, Food, and Natural Resources | 725 | 463 | 0% | 0% | 88% | 84% |
Architecture and Construction | 100 | 373 | 0% | 0% | 65% | 78% |
Business and Marketing | 6,871 | 6,907 | 1% | 1% | 80% | 78% |
Communication and Audio/Visual Technology | 1,860 | 1,604 | 0% | 0% | 81% | 72% |
Engineering and Technology | 961 | 1,593 | 0% | 0% | 85% | 84% |
English Language and Literature | 90,104 | 88,184 | 18% | 18% | 64% | 62% |
Health Care Sciences | 2,964 | 1,025 | 1% | 0% | 84% | 75% |
Hospitality and Tourism | 773 | 527 | 0% | 0% | 71% | 69% |
Human Services | 5,330 | 3,980 | 1% | 1% | 76% | 72% |
Information Technology | 6,998 | 8,621 | 1% | 2% | 71% | 72% |
Integrative Learning | 1,552 | 1,456 | 0% | 0% | 93% | 95% |
Life and Physical Sciences | 74,673 | 72,858 | 15% | 15% | 65% | 62% |
Manufacturing | NR | 330 | 0% | 0% | NR | 92% |
Mathematics | 86,713 | 85,087 | 17% | 18% | 63% | 61% |
Military Science | NR | NR | 0% | 0% | NR | NR |
Miscellaneous | 32,761 | 31,909 | 7% | 7% | 72% | 68% |
Nonsubject Specific | 1,867 | 2,177 | 0% | 0% | 87% | 88% |
Physical, Health, and Safety Education | 38,829 | 37,632 | 8% | 8% | 67% | 64% |
Public, Protective, and Government Services | 1,240 | 629 | 0% | 0% | 84% | 79% |
Religious Education and Theology | NR | NR | 0% | 0% | NR | NR |
Social Sciences and History | 83,280 | 77,873 | 17% | 16% | 67% | 64% |
Transportation, Distribution, and Logistics | NR | NR | 0% | 0% | NR | NR |
Visual and Performing Arts | 36,993 | 33,656 | 7% | 7% | 68% | 64% |
World Languages | 27,898 | 24,605 | 6% | 5% | 63% | 58% |
Total | 502,686 | 481,673 | 100% | 100% | 67% | 64% |
Note: Data are not reported (NR) out of caution for confidentiality. Pass Rate data are not reported (NR) if there were fewer than 10 schools, fewer than 25 students, or fewer than 100 enrollments.
Back to discussion of Table C10
Table C11. 2024-25 Number of Virtual Enrollments by Students' Sex with Percentage of Title for AP Courses with Minimum of 100 Virtual Enrollments
AP Course Title | # of Female Enrolls | # of Male Enrolls | % Female | % Male | Female Pass Rate | Male Pass Rate |
|---|---|---|---|---|---|---|
AP Art History | 117 | 84 | 58% | 42% | 85% | 74% |
AP Biology | 148 | 73 | 67% | 33% | 92% | 84% |
AP Calculus AB | 76 | 119 | 39% | 61% | 88% | 89% |
AP Calculus BC | 85 | 121 | 41% | 59% | 96% | 94% |
AP Chemistry | 73 | 67 | 52% | 48% | 86% | 84% |
AP Computer Science A | 116 | 229 | 34% | 66% | 86% | 91% |
AP English Language and Composition | 246 | 125 | 66% | 34% | 86% | 79% |
AP English Literature and Composition | 176 | 70 | 72% | 28% | 94% | 97% |
AP Environmental Science | 127 | 68 | 65% | 35% | 94% | 94% |
AP Human Geography | 72 | 71 | 50% | 50% | 93% | 94% |
AP Macroeconomics | 129 | 179 | 42% | 58% | 97% | 93% |
AP Microeconomics | 162 | 176 | 48% | 52% | 94% | 88% |
AP Physics 1 | 37 | 86 | 30% | 70% | 89% | 90% |
AP Physics C | 48 | 88 | 35% | 65% | 94% | 97% |
AP Psychology | 665 | 279 | 70% | 30% | 91% | 91% |
AP Spanish Language and Culture | 77 | 49 | 61% | 39% | 81% | 84% |
AP Statistics | 235 | 138 | 63% | 37% | 94% | 91% |
AP U.S. Government and Politics | 110 | 74 | 60% | 40% | 93% | 86% |
AP U.S. History | 122 | 75 | 62% | 38% | 89% | 89% |
AP World History: Modern | 159 | 104 | 60% | 40% | 87% | 88% |
Total | 2,980 | 2,275 | 57% | 43% | 91% | 89% |
Note: Data are not reported (NR) out of caution for confidentiality. Pass Rate data are not reported (NR) if there were fewer than 10 schools, fewer than 25 students, or fewer than 100 enrollments for that course title.
Back to discussion of Table C11
Table C12. 2024-25 Number of Schools, Virtual Students, and Virtual Enrollments with Percentage of Virtual Enrollments and Pass Rate by Virtual Method
Virtual Method | # of Schools | # of Students | # of Enrolls | % of Enrolls | Pass Rate |
|---|---|---|---|---|---|
Blended Learning | 192 | 10,024 | 46,559 | 5% | 66% |
Digital Learning | 283 | 17,970 | 83,884 | 9% | 59% |
Online Course | 1,221 | 128,364 | 853,916 | 87% | 66% |
Total | 1,363 | 150,304 | 984,359 | 100% | 65% |
Note: Since schools and students may have enrollments across multiple virtual methods, row counts may not equal the total. The total row, however, reflects the number of unique schools and students.
Back to discussion of Table C12
Appendix D - Student Tables
Click on the link below the table to return to the section of the report that discusses the table.
Table D1. 2024-25 Number of Schools and Virtual Students with Percentage of Virtual Students and Percent Year over Year Change
Grade Level | # of Schools | # of Students | % of Students | % Change from Prior Year |
|---|---|---|---|---|
K | 96 | 2,257 | 2% | -16% |
1 | 105 | 2,810 | 2% | -20% |
2 | 113 | 2,968 | 2% | -9% |
3 | 117 | 3,186 | 2% | -3% |
4 | 122 | 2,993 | 2% | -8% |
5 | 148 | 3,464 | 2% | -6% |
6 | 254 | 4,797 | 3% | -7% |
7 | 357 | 6,343 | 4% | -4% |
8 | 451 | 8,023 | 5% | 1% |
9 | 768 | 20,283 | 13% | 0% |
10 | 834 | 24,006 | 16% | -4% |
11 | 877 | 28,115 | 19% | -3% |
12 | 885 | 41,997 | 28% | 1% |
Total | 1,363 | 150,304 | 100% | -2% |
Note: Because some students took courses across multiple schools and grade levels, a student may be counted toward more than one school and grade level. The total row, however, reflects the number of unique students.
Back to discussion of Table D1
Table D2. 2024-25 Number of Schools, Virtual Students, Virtual Enrollments with Percentage of Virtual Students and Virtual Enrollments and Virtual Pass Rate by Student Sex
Student Sex | # of Schools | # of Students | % of Students | # of Enrolls | % of Enrolls | Pass Rate |
|---|---|---|---|---|---|---|
Female | 1,253 | 77,144 | 51% | 502,686 | 51% | 67% |
Male | 1,280 | 73,187 | 49% | 481,673 | 49% | 64% |
Total | 1,363 | 150,304 | 100% | 984,359 | 100% | 65% |
Note: The sum of the number of schools and students exceeds the total number because some schools enrolled students of both sexes and some students had enrollments across multiple schools where one school listed the student as one sex, but another school reported a different value. The unique total was used to emphasize the true number of virtual students.
Back to discussion of Table D2
Table D3. 2024-25 Number of Schools, Virtual Students, Virtual Enrollments with Percentage of Virtual Students and Virtual Enrollments and Virtual Pass Rate by Race/Ethnicity
Race/Ethnicity | # of Schools | # of Students | % of Students | # of Enrolls | % of Enrolls | Pass Rate |
|---|---|---|---|---|---|---|
African American or Black | 808 | 28,794 | 19% | 216,593 | 22% | 59% |
American Indian or Alaska Native | 352 | 1,063 | 1% | 6,594 | 1% | 56% |
Asian | 442 | 3,071 | 2% | 15,184 | 2% | 81% |
Hispanic or Latino | 941 | 13,942 | 9% | 92,758 | 9% | 59% |
Native Hawaiian or Pacific Islander | 91 | 142 | 0% | 866 | 0% | 63% |
White | 1,264 | 93,246 | 62% | 582,056 | 59% | 68% |
Two or More Races | 871 | 9,265 | 6% | 66,403 | 7% | 64% |
Unknown | 138 | 1,419 | 1% | 3,905 | 0% | 49% |
Total | 1,363 | 150,304 | 100% | 984,359 | 100% | 65% |
Note: The sum of the number of schools and the number of students exceeds the total number because a few students had enrollments across multiple schools where one school listed the student as one race/ethnicity, but another school reported a different value. The unique total was used to emphasize the true number of virtual students.
Back to discussion of Table D3
Table D4. 2024-25 Number of Schools, Virtual Students, Virtual Enrollments with Percentage of Virtual Students and Virtual Enrollments and Virtual Pass Rate by Poverty Status
Poverty Status | # of Schools | # of Students | % of Students | # of Enrolls | % of Enrolls | Pass Rate |
|---|---|---|---|---|---|---|
Yes | 1,272 | 90,948 | 61% | 675,441 | 69% | 60% |
No | 1,201 | 58,106 | 39% | 304,061 | 31% | 77% |
Unknown | 139 | 1,549 | 1% | 4,857 | 0% | 53% |
Total | 1,363 | 150,304 | 100% | 984,359 | 100% | 65% |
Note: The sum of the number of schools and students exceeds the total number because some schools enrolled students across both poverty statuses and some students had enrollments across multiple schools where one school listed the student as one poverty status, but another school reported a different value. The unique total was used to emphasize the true number of virtual students.
Back to discussion of Table D4
Table D5. 2024-25 Pass Rate Comparison for Students in Their Virtual and Non-Virtual Courses by Poverty Status
Poverty Status | Virtual Pass Rate | Non-Virtual Pass Rate | Virtual Pass Rate - Non-Virtual Pass Rate |
|---|---|---|---|
Yes | 60% | 65% | -5% |
No | 77% | 87% | -10% |
Unknown | 53% | 33% | 20% |
Total | 65% | 75% | -9% |
Note: The Virtual Pass Rate – Non-Virtual Pass Rate calculation was run prior to rounding. That rounding effect accounts for what may appear to be calculation differences.
Back to discussion of Table D5
Table D6. 2024-25 Percentage of Virtual Students and Virtual Enrollments in Poverty with Pass Rate by Virtual Type
Virtual Type | % of Students in Poverty | % of Enrolls from Students in Poverty | Pass Rate for Students in Poverty |
|---|---|---|---|
Full-Time Virtual | 71% | 73% | 60% |
Part-Time Virtual | 56% | 64% | 59% |
Total | 61% | 69% | 60% |
Back to discussion of Table D6
Table D7. 2024-25 Number and Percentage of Virtual Students by Free or Reduced-Price Lunch Category
Free or Reduced-Price Lunch Category | # of Virtual Students | # of All MI Students | % of Virtual Students |
|---|---|---|---|
Low FRL (<=25%) | 22,490 | 296,477 | 8% |
Mid-Low FRL (>25% to <=50%) | 31,632 | 415,312 | 8% |
Mid-High FRL (>50% to <=75%) | 49,720 | 369,256 | 13% |
High FRL (>75%) | 48,000 | 292,459 | 16% |
Missing | 728 | 0 | NA |
Total | 150,304 | 1,366,207 | 11% |
Note: The sum of the number of students exceeds the total number because some students had enrollments across categories. The unique total was used to emphasize the true number of virtual students. All Michigan K-12 schools with building codes were used to calculate the state figures. The 1.3M total reflects the number of unique Michigan K-12 students.
Back to discussion of Table D7
Table D8. 2024-25 Number of Schools, Virtual Students, Virtual Enrollments with Percentage of Virtual Students and Virtual Enrollments and Virtual Pass Rate by Special Education Status
Special Education Status | # of Schools | # of Students | % of Students | # of Enrolls | % of Enrolls | Pass Rate |
|---|---|---|---|---|---|---|
Yes | 1,097 | 20,523 | 14% | 147,161 | 15% | 59% |
No | 1,301 | 128,531 | 86% | 832,341 | 85% | 66% |
Unknown | 139 | 1,549 | 1% | 4,857 | 0% | 53% |
Total | 1,363 | 150,304 | 100% | 984,359 | 100% | 65% |
Note: The sum of the school and student rows exceeds the total number because some students had enrollments across multiple schools, where one school listed the student under a specific special education status, but another school reported a different status. The unique total was used to emphasize the true number of virtual students.
Back to discussion of Table D8
Table D9. 2024-25 Number of Schools, Virtual Students, Virtual Enrollments with Percentage of Virtual Students and Virtual Enrollments and Virtual Pass Rate by Primary Disability
Primary Disability | # of Schools | # of Students | % of Students | # of Enrolls | % of Enrolls | Pass Rate |
|---|---|---|---|---|---|---|
Autism Spectrum Disorder | 412 | 1,723 | 8% | 11,853 | 8% | 70% |
Cognitive Impairment | 280 | 1,300 | 6% | 8,792 | 6% | 56% |
Deaf-Blindness | NR | NR | 0% | NR | 0% | NR |
Deaf or Hard of Hearing | 100 | 127 | 1% | 807 | 1% | 67% |
Early Childhood Developmental Delay | 21 | 48 | 0% | 352 | 0% | 53% |
Emotional Impairment | 671 | 2,768 | 13% | 20,591 | 14% | 49% |
Physical Impairment | 38 | 59 | 0% | 422 | 0% | 68% |
Specific Learning Disability | 840 | 7,818 | 38% | 55,580 | 38% | 59% |
Speech and Language Impairment | 288 | 1,510 | 7% | 11,804 | 8% | 69% |
Severe Multiple Impairment | 11 | 96 | 0% | 182 | 0% | 73% |
Traumatic Brain Injury | 39 | 48 | 0% | 303 | 0% | 55% |
Visual Impairment | 52 | 59 | 0% | 395 | 0% | 65% |
Other Health Impairment | 806 | 4,620 | 23% | 33,283 | 23% | 57% |
Missing/None Listed | 142 | 446 | 2% | 2,764 | 2% | 45% |
Total | 1,097 | 20,523 | 100% | 147,161 | 100% | 59% |
Note: The sum of the student rows exceeds the total number because some students had enrollments across multiple schools, where one school listed the student with a specific primary disability, but another school reported a different primary disability. The unique total was used to emphasize the true number of virtual students. Data are not reported (NR) out of caution for confidentiality. Pass Rate data are not reported (NR) if there were fewer than 10 schools, fewer than 25 students, or fewer than 100 enrollments.
Back to discussion of Table D9
Table D10. 2024-25 Number and Percentage of Virtual Students Compared to All MI Students with IEPs by Primary Disability
Primary Disability | # of Virtual Students | # of All MI Students with IEPs | % of All MI Students with IEPs Who Took a Virtual Course | % of All MI Students with IEPs |
|---|---|---|---|---|
Autism Spectrum Disorder | 1,723 | 30,134 | 6% | 16% |
Cognitive Impairment | 1,300 | 16,898 | 8% | 9% |
Deaf-Blindness | NR | 35 | NR | 0% |
Deaf or Hard of Hearing | 127 | 2,146 | 6% | 1% |
Early Childhood Developmental Delay | 48 | 9,327 | 1% | 5% |
Emotional Impairment | 2,768 | 10,259 | 27% | 5% |
Physical Impairment | 59 | 1,197 | 5% | 1% |
Specific Learning Disability | 7,818 | 55,947 | 14% | 30% |
Speech and Language Impairment | 1,510 | 61,006 | 2% | 32% |
Severe Multiple Impairment | 96 | 2,669 | 4% | 1% |
Traumatic Brain Injury | 48 | 396 | 12% | 0% |
Visual Impairment | 59 | 687 | 9% | 0% |
Other Health Impairment | 4,620 | 32,399 | 14% | 17% |
Missing/None Listed | 446 | NA | NA | NA |
Total | 20,523 | 189,618 | 11% | 100% |
Note: The sum of the student rows exceeds the total number because some students had enrollments across multiple schools, where one school listed the student with a specific primary disability, but another school reported a different primary disability. The unique total was used to emphasize the true number of virtual students. Data are not reported (NR) out of caution for confidentiality.
Back to discussion of Table D10
Table D11. 2024-25 Number of Schools, Virtual Students, Virtual Enrollments with Percentage of Virtual Students and Virtual Enrollments and Virtual Pass Rate by Home-School/Nonpublic Student Status
Home-School or Nonpublic Student Status | # of Schools | # of Students | % of Students | # of Enrolls | % of Enrolls | Pass Rate |
|---|---|---|---|---|---|---|
No | 1,357 | 142,759 | 95% | 950,112 | 97% | 64% |
Yes | 81 | 7,561 | 5% | 34,247 | 3% | 93% |
Total | 1,363 | 150,304 | 100% | 984,359 | 100% | 65% |
Back to discussion of Table D11
Table D12. 2024-25 Number of Schools, Virtual Students, Virtual Enrollments with Percentage of Virtual Students and Virtual Enrollments and Virtual Pass Rate by Full- or Part-Time Status
Virtual Subset | # of Schools | # of Students | % of Students | # of Enrolls | % of Enrolls | Pass Rate |
|---|---|---|---|---|---|---|
Full-Time Virtual | 70 | 49,864 | 33% | 490,800 | 50% | 64% |
Part-Time Virtual | 1,293 | 102,020 | 68% | 493,559 | 50% | 66% |
Total | 1,363 | 150,304 | 100% | 984,359 | 100% | 65% |
Note: The sum of the student rows exceeds the total number because some students had enrollments in both full-time and part-time virtual schools. The total reflects the number of unique virtual students.
Back to discussion of Table D12
Table D13. 2024-25 Pass Rate Comparison for Full- and Part-Time Virtual Students by Virtual Subset
Virtual Subset | Virtual Pass Rate | Non-Virtual Pass Rate |
|---|---|---|
Full-Time Virtual | 64% | 89% |
Part-Time Virtual | 66% | 74% |
Total | 65% | 75% |
Note: There were 16,475 non-virtual enrollments reported for full-time virtual students.
Back to discussion of Table D13
Table D14. 2024-25 Number and Percentage of Virtual Students and Virtual Enrollments with Pass Rates by Students' Percentage of Enrollments Taken Virtually
% of Enrollments Taken Virtually | # of Students | % of Students | # of Enrolls | % of Enrolls | Pass Rate |
|---|---|---|---|---|---|
<25% of Enrolls Virtual | 48,917 | 33% | 84,586 | 9% | 76% |
25% to 49% of Enrolls Virtual | 20,861 | 14% | 105,796 | 11% | 63% |
50% to 74% of Enrolls Virtual | 13,141 | 9% | 120,208 | 12% | 59% |
75% or More of Enrolls Virtual | 67,385 | 45% | 673,769 | 68% | 65% |
Total | 150,304 | 100% | 984,359 | 100% | 65% |
Back to discussion of Table D14
Table D15. 2024-25 Number and Percentage of Virtual Students and Virtual Enrollments from LEA Schools Only with Pass Rates by Students' Percentage of Enrollments Taken Virtually
% of Enrollments Taken Virtually | # of Students | % of Students | # of Enrolls | % of Enrolls | Pass Rate |
|---|---|---|---|---|---|
<25% of Enrolls Virtual | 46,376 | 43% | 77,592 | 13% | 78% |
25% to 49% of Enrolls Virtual | 15,782 | 15% | 70,995 | 12% | 68% |
50% to 74% of Enrolls Virtual | 8,301 | 8% | 70,254 | 12% | 62% |
75% or More of Enrolls Virtual | 37,882 | 35% | 357,445 | 62% | 62% |
Total | 108,341 | 100% | 576,286 | 100% | 65% |
Back to discussion of Table D15
Table D16. 2024-25 Number and Percentage of Virtual Students and Virtual Enrollments from PSA Schools Only with Pass Rates by Students' Percentage of Enrollments Taken Virtually
% of Enrollments Taken Virtually | # of Students | % of Students | # of Enrolls | % of Enrolls | Pass Rate |
|---|---|---|---|---|---|
<25% of Enrolls Virtual | 2,075 | 5% | 4,136 | 1% | 52% |
25% to 49% of Enrolls Virtual | 1,706 | 4% | 10,256 | 3% | 51% |
50% to 74% of Enrolls Virtual | 1,318 | 3% | 12,443 | 3% | 54% |
75% or More of Enrolls Virtual | 35,274 | 87% | 361,601 | 93% | 65% |
Total | 40,373 | 100% | 388,436 | 100% | 64% |
Back to discussion of Table D16
Table D17. 2024-25 Number of Schools, Virtual Students, Virtual Enrollments with Percentage of Virtual Students and Virtual Enrollments and Virtual Pass Rate by District Mobility
District Mobility | # of Schools | # of Students | % of Schools | # of Enrolls | % of Enrolls | Pass Rate |
|---|---|---|---|---|---|---|
Stable | 1,340 | 128,717 | 86% | 813,059 | 83% | 71% |
Incoming | 640 | 9,191 | 6% | 68,866 | 7% | 56% |
Outgoing | 902 | 13,819 | 9% | 98,529 | 10% | 26% |
Missing | 138 | 1,419 | 1% | 3,905 | 0% | 49% |
Total | 1,363 | 150,304 | 100% | 984,359 | 100% | 65% |
Back to discussion of Table D17
Table D18. 2024-25 Number and Percentage of Virtual Enrollments with Pass Rates by Known Poverty Status and District Mobility
District Mobility | # of In Poverty Enrolls | # of Not In Poverty Enrolls | % of In Poverty Enrolls | % of Not In Poverty Enrolls | In Poverty Pass Rate | Not In Poverty Pass Rate |
|---|---|---|---|---|---|---|
Stable | 538,903 | 273,289 | 80% | 90% | 66% | 80% |
Incoming | 57,468 | 11,375 | 9% | 4% | 55% | 60% |
Outgoing | 79,070 | 19,397 | 12% | 6% | 23% | 40% |
Total | 675,441 | 304,061 | 100% | 100% | 60% | 77% |
Note: Table excludes 4,857 enrollments that had an unknown value for the PovertyFlag variable.
Back to discussion of Table D18
Table D19. 2024-25 Percentage of Virtual Enrollments by Locale and District Mobility
District Mobility | % of Rural Enrolls | % of Town Enrolls | % of Suburban Enrolls | % of City Enrolls | % of Not Specified Enrolls |
|---|---|---|---|---|---|
Stable | 80% | 82% | 85% | 83% | 79% |
Incoming | 10% | 8% | 5% | 5% | 14% |
Outgoing | 10% | 10% | 10% | 11% | 6% |
Missing | 0% | 0% | 1% | 1% | 0% |
Total | 100% | 100% | 100% | 100% | 100% |
Back to discussion of Table D19
Table D20. 2024-25 Virtual Pass Rates by Locale and District Mobility
District Mobility | Rural Pass Rate | Town Pass Rate | Suburban Pass Rate | City Pass Rate | Not Specified Pass Rate |
|---|---|---|---|---|---|
Stable | 68% | 67% | 75% | 67% | NR |
Incoming | 54% | 55% | 63% | 47% | NR |
Outgoing | 19% | 25% | 32% | 27% | NR |
Missing | 49% | 74% | 47% | 41% | NR |
Total | 62% | 62% | 70% | 61% | NR |
Note: Pass Rate data are not reported (NR) if there were fewer than 10 schools, fewer than 25 students, or fewer than 100 enrollments.
Back to discussion of Table D20
Table D21. 2024-25 Percentage of Virtual Enrollments with Pass Rates by Full-Time (FT) or Part-Time (PT) Virtual Status and District Mobility
District Mobility | % of FT Enrolls | % of PT Enrolls | FT Pass Rate | PT Pass Rate |
|---|---|---|---|---|
Stable | 78% | 87% | 70% | 71% |
Incoming | 11% | 3% | 58% | 50% |
Outgoing | 11% | 9% | 28% | 24% |
Missing | 0% | 1% | 27% | 54% |
Total | 100% | 100% | 64% | 66% |
Back to discussion of Table D21
Table D22. 2024-25 Number and Percentage of Part-Time Virtual Students and Virtual Enrollments with Pass Rate by Non-Virtual Performance (Minimum of 3 Non-Virtual Enrollments)
Non-Virtual Performance | # of Students | % of Students | # of Enrolls | % of Enrolls | Pass Rate |
|---|---|---|---|---|---|
Passed All NV Courses | 37,612 | 45% | 106,550 | 32% | 85% |
Did Not Pass 1 or 2 NV Courses | 15,237 | 18% | 51,766 | 16% | 72% |
Did Not Pass 3 or More NV Courses | 29,870 | 36% | 172,982 | 52% | 50% |
Total | 82,719 | 100% | 331,298 | 100% | 65% |
Back to discussion of Table D22
Table D23. 2024-25 Number and Percentage of Virtual Students and Virtual Enrollments with Virtual Pass Rate by Virtual Course Performance
Virtual Course Performance | # of Students | % of Students | # of Enrolls | % of Enrolls | Pass Rate |
|---|---|---|---|---|---|
Passed All | 79,789 | 53% | 385,353 | 39% | 100% |
Passed Some, But Not All | 46,724 | 31% | 468,486 | 48% | 55% |
Didn't Pass Any | 23,791 | 16% | 130,520 | 13% | 0% |
Total | 150,304 | 100% | 984,359 | 100% | 65% |
Back to discussion of Table D23
Table D24. 2024-25 Number and Percentage of Virtual Students Who Did Not Pass Any Virtual Courses by the Number of Virtual Courses They Took
# of Virtual Courses Not Passed | # of Students | % of Students |
|---|---|---|
1 to 2 | 8,230 | 35% |
3 to 4 | 2,396 | 10% |
5 to 6 | 5,373 | 23% |
7 to 8 | 2,792 | 12% |
9 to 10 | 1,407 | 6% |
11+ | 3,593 | 15% |
Total | 23,791 | 100% |
Back to discussion of Table D24
Table D25. 2024-25 Number and Percentage of Virtual Students and Virtual Enrollments with Pass Rates by Virtual Usage
Virtual Usage | # of Students | % of Students | # of Enrolls | % of Enrolls | Pass Rate |
|---|---|---|---|---|---|
1 to 2 Virtual Courses | 50,173 | 33% | 72,810 | 7% | 81% |
3 to 4 Virtual Courses | 17,035 | 11% | 59,311 | 6% | 75% |
5 or More Virtual Courses | 83,096 | 55% | 852,238 | 87% | 63% |
Total | 150,304 | 100% | 984,359 | 100% | 65% |
Back to discussion of Table D25
Table D26. 2024-25 Virtual Pass Rate by Virtual Method and Virtual Usage
Virtual Usage | Blended Learning Pass Rate | Digital Learning Pass Rate | Online Course Pass Rate | Total Pass Rate |
|---|---|---|---|---|
1 to 2 Virtual Courses | 83% | 69% | 81% | 81% |
3 to 4 Virtual Courses | 64% | 59% | 76% | 75% |
5 or More Virtual Courses | 62% | 57% | 64% | 63% |
Total | 66% | 59% | 66% | 65% |
Back to discussion of Table D26
Appendix E - State Assessment Tables
Click on the link below the table to return to the section of the report that discusses the table.
Table E1. 2024-25 Comparison of Virtual and State Proficiency Rates on 11th Grade State Assessment Measures
Assessment | Virtual Learners | All Learners Statewide |
|---|---|---|
Evidence-Based Reading & Writing (SAT) | 45% | 55% |
Mathematics (SAT) | 19% | 28% |
Science (M-STEP) | 29% | 35% |
Social Studies (M-STEP) | 34% | 42% |
Note: Statewide assessment data were available from the MI School Data Portal. SAT measures are on the College Readiness report. The M-STEP measures can be found on the High School State Testing Performance report.
Back to discussion of Table E1
Table E2. 2024-25 Comparison of Virtual and State Proficiency Rates on 8th Grade State Assessment Measures
Assessment | Virtual Learners | All Learners Statewide |
|---|---|---|
Evidence-Based Reading & Writing (SAT) | 52% | 65% |
Mathematics (SAT) | 14% | 30% |
Science (M-STEP) | 28% | 41% |
Social Studies (M-STEP) | 31% | 47% |
Note: Statewide assessment data were available from the MI School Data Portal. SAT measures are on the College Readiness report. The M-STEP measures can be found on the High School State Testing Performance report.
Back to discussion of Table E2
Table E3. 2024-25 11th Grade State Assessment Proficiency Rates for Virtual Learners with Three or More Non-Virtual Enrollments by Non-Virtual Performance
Assessment | Passed All NV | Did Not Pass 1 or 2 NV | Did Not Pass 3 or More NV | All Learners Statewide |
|---|---|---|---|---|
Evidence-Based Reading & Writing (SAT) | 67% | 41% | 26% | 55% |
Mathematics (SAT) | 36% | 15% | 6% | 28% |
Science (M-STEP) | 44% | 25% | 14% | 35% |
Social Studies (M-STEP) | 51% | 30% | 18% | 42% |
Back to discussion of Table E3
Table E4. 2024-25 8th Grade State Assessment Proficiency Rates for Virtual Learners with Three or More Non-Virtual Enrollments by Non-Virtual Performance
Assessment | Passed All NV | Did Not Pass 1 or 2 NV | Did Not Pass 3 or More NV | All Learners Statewide |
|---|---|---|---|---|
Evidence-Based Reading & Writing (SAT) | 72% | 52% | 36% | 65% |
Mathematics (SAT) | 35% | 22% | 5% | 30% |
Science (M-STEP) | 48% | 33% | 14% | 41% |
Social Studies (M-STEP) | 54% | 36% | 16% | 47% |
Back to discussion of Table E4
Table E5. 2024-25 11th Grade State Assessment Proficiency Rates for Virtual Learners by Poverty Status
Assessment | In Poverty | Not In Poverty | All Virtual Learners | All Learners Statewide |
|---|---|---|---|---|
Evidence-Based Reading & Writing (SAT) | 31% | 61% | 45% | 55% |
Mathematics (SAT) | 8% | 31% | 19% | 28% |
Science (M-STEP) | 18% | 40% | 29% | 35% |
Social Studies (M-STEP) | 22% | 46% | 34% | 42% |
Back to discussion of Table E5
Table E6. 2024-25 8th Grade State Assessment Proficiency Rates for Virtual Learners by Poverty Status
Assessment | In Poverty | Not In Poverty | All Virtual Learners | All Learners Statewide |
|---|---|---|---|---|
Evidence-Based Reading & Writing (SAT) | 43% | 72% | 52% | 65% |
Mathematics (SAT) | 7% | 30% | 14% | 30% |
Science (M-STEP) | 19% | 47% | 28% | 41% |
Social Studies (M-STEP) | 21% | 52% | 31% | 47% |
Back to discussion of Table E6
Table E7. 2024-25 11th Grade State Assessment Proficiency Rates for Virtual Learners by Virtual Type
Assessment | Part-Time | Full-Time | All Virtual Learners | All Learners Statewide |
|---|---|---|---|---|
Evidence-Based Reading & Writing (SAT) | 47% | 34% | 45% | 55% |
Mathematics (SAT) | 21% | 6% | 19% | 28% |
Science (M-STEP) | 30% | 20% | 29% | 35% |
Social Studies (M-STEP) | 36% | 23% | 34% | 42% |
Back to discussion of Table E7
Table E8. 2024-25 8th Grade State Assessment Proficiency Rates for Virtual Learners by Virtual Type
Assessment | Part-Time | Full-Time | All Virtual Learners | All Learners Statewide |
|---|---|---|---|---|
Evidence-Based Reading & Writing (SAT) | 55% | 50% | 52% | 65% |
Mathematics (SAT) | 20% | 8% | 14% | 30% |
Science (M-STEP) | 33% | 23% | 28% | 41% |
Social Studies (M-STEP) | 36% | 26% | 31% | 47% |
Back to discussion of Table E8
Appendix F - Higher Performing Schools Tables
Click on the link below the table to return to the section of the report that discusses the table.
Table F1. 2024-25 Number and Percentage of Schools with 80% or Higher Pass Rate by Virtual Learner Count Category
Virtual Learner Count | School Count | % of Schools |
|---|---|---|
10 or Fewer | 198 | 33% |
11 to 25 | 80 | 13% |
26 to 50 | 66 | 11% |
51 to 99 | 97 | 16% |
100 or More | 156 | 26% |
Total | 597 | 100% |
Back to discussion of Table F1
Table F2. 2024-25 Number and Percentage of Schools and Virtual Enrollments from Schools with 80% or Higher Pass Rate by Virtual Count Category
Virtual Enroll Count | # of Schools | % of Schools | # of Virtual Enrolls | % of Virtual Enrolls |
|---|---|---|---|---|
1 to 9 | 106 | 18% | 481 | 0% |
10 to 29 | 95 | 16% | 1,655 | 1% |
30 to 49 | 46 | 8% | 1,800 | 1% |
50 to 99 | 67 | 11% | 4,739 | 2% |
100 or More | 283 | 47% | 277,623 | 97% |
Total | 597 | 100% | 286,298 | 100% |
Back to discussion of Table F2
Table F3. 2024-25 Number and Percentage of Schools with 80% or Higher Pass Rate by Number of Virtual Courses Offered
Virtual Courses Offered | # of Schools | % of Schools |
|---|---|---|
10 or Fewer | 222 | 37% |
11 to 25 | 121 | 20% |
26 to 50 | 148 | 25% |
More than 50 | 106 | 18% |
Total | 597 | 100% |
Back to discussion of Table F3
Table F4. 2024-25 Number and Percentage of Schools with 80% or Higher Pass Rate as a Percentage of All Virtual Schools
Entity Type | # of Higher Performing Schools | # of Virtual Schools | % of Virtual Schools |
|---|---|---|---|
ISD School | 11 | 26 | 42% |
ISD Unique Education Provider | NR | NR | NR |
LEA School | 539 | 1,201 | 45% |
LEA Unique Education Provider | NR | 12 | NR |
PSA School | 37 | 119 | 31% |
State School | NR | NR | NR |
Total | 597 | 1,363 | 44% |
Note: Data are not reported (NR) out of caution for confidentiality.
Back to discussion of Table F4
Table F5. 2024-25 Number and Percentage of Schools with 80% or Higher Pass Rate by Locale
Locale | # of Higher Performing Schools | # of Virtual Schools | % of Virtual Schools |
|---|---|---|---|
Rural | 221 | 471 | 47% |
Town | 83 | 196 | 42% |
Suburb | 213 | 482 | 44% |
City | 77 | 206 | 37% |
Not Specified | 3 | 8 | 38% |
Total | 597 | 1,363 | 44% |
Back to discussion of Table F5
Table F6. 2024-25 Number of Students and Virtual Enrollments with Pass Rate Data from Schools with 80% or Higher Pass Rate by Race/Ethnicity
Race/Ethnicity | # of Students | # of Enrolls | Pass Rate |
|---|---|---|---|
African-American or Black | 6,370 | 39,416 | 86% |
American Indian or Alaska Native | 323 | 1,474 | 82% |
Asian | 1,793 | 7,349 | 93% |
Hispanic or Latino | 4,197 | 20,882 | 87% |
Native Hawaiian or Pacific Islander | 60 | 305 | 84% |
Two or More Races | 3,194 | 18,190 | 88% |
Unknown | 587 | 1,377 | 79% |
White | 41,441 | 197,305 | 90% |
Total | 57,910 | 286,298 | 89% |
Back to discussion of Table F6
Table F7. 2024-25 Number of Students and Virtual Enrollments with Pass Rate Data from Schools with 80% or Higher Pass Rate by Poverty Status
Poverty Status | # of Students | % of Students | # of Enrolls | % of Enrolls | Pass Rate |
|---|---|---|---|---|---|
Yes | 25,693 | 44% | 150,400 | 53% | 86% |
No | 31,647 | 55% | 134,492 | 47% | 92% |
Unknown | 613 | 1% | 1,406 | 0% | 79% |
Total | 57,910 | 100% | 286,298 | 100% | 89% |
Back to discussion of Table F7
Table F8. 2024-25 Number and Percentage of Schools with 80% or Higher Pass Rate by School Free or Reduced-Price Lunch Category
Free or Reduced-Price Lunch Category | # of Higher Performing Schools | % of Higher Performing Schools | # of All Virtual Schools | % of All Virtual Schools |
|---|---|---|---|---|
Low FRL (≤ 25%) | 153 | 26% | 215 | 71% |
Mid-Low FRL (>25% to ≤ 50%) | 210 | 35% | 400 | 53% |
Mid-High FRL (>50% to ≤ 75%) | 160 | 27% | 458 | 35% |
High FRL (>75%) | 71 | 12% | 282 | 25% |
Missing | 3 | 1% | 8 | 38% |
Total | 597 | 100% | 1,363 | 44% |
Back to discussion of Table F8
Table F9. 2024-25 Number and Percentage of Schools with 80% or Higher Pass Rate by Full- or Part-Time Status
Full- or Part-Time Status | # of Higher Performing Schools | % of Higher Performing Schools | # of All Virtual Schools | % of All Virtual Schools |
|---|---|---|---|---|
Full-Time | 17 | 3% | 70 | 24% |
Part-Time | 580 | 97% | 1,293 | 45% |
Total | 597 | 100% | 1,363 | 44% |
Back to discussion of Table F9
Table F10. 2024-25 Number and Percentage of Schools with 80% or Higher Pass Rate by School Emphasis
School Emphasis | # of Higher Performing Schools | # of All Virtual Schools | % of All Virtual Schools |
|---|---|---|---|
Alternative Education | 47 | 272 | 17% |
General Education | 543 | 1,069 | 51% |
Special Education | NR | NR | NR |
Vocational/CTE | NR | NR | NR |
Total | 597 | 1,363 | 44% |
Note: Data are not reported (NR) out of caution for confidentiality.
Back to discussion of Table F10
Table F11. 2024-25 Number and Percentage of Students* from Schools with 80% or Higher Pass Rate by Pass Rate Difference Category
Pass Rate Difference Category | # of Students | % of Students |
|---|---|---|
Virtual Less than Non-Virtual | 1,819 | 17% |
Virtual Met/Exceeded Non-Virtual | 9,180 | 83% |
Total | 10,999 | 100% |
Note: Only virtual learners who took a minimum of three virtual courses and three non-virtual courses are included in the table.
Back to discussion of Table F11
Appendix G - Completion Status Tables
Click on the link below the table to return to the section of the report that discusses the table.
Table G1. 2024-25 Number and Percentage of Virtual Enrollments by Completion Status
Completion Status | # of Enrolls | % of Enrolls |
|---|---|---|
Audited | 1,033 | 0% |
Completed/Failed | 128,918 | 13% |
Completed/Passed | 641,569 | 65% |
Incomplete | 75,860 | 8% |
Ongoing Enrolled | NR | 0% |
Tested Out | NR | 0% |
Withdrawn/Exited | 85,910 | 9% |
Withdrawn/Failing | 16,536 | 2% |
Withdrawn/Passing | 34,407 | 3% |
Total | 984,359 | 100% |
Note: Data are not reported (NR) out of caution for confidentiality.
Back to discussion of Table G1
Table G2. 2024-25 Percentage of Virtual Enrollments by Completion Status and Entity Type
Completion Status | ISD School % of Enrolls | ISD UEP % of Enrolls | LEA School % of Enrolls | LEA UEP % of Enrolls | PSA School % of Enrolls |
|---|---|---|---|---|---|
Audited | 0% | 0% | 0% | 0% | 0% |
Completed/Failed | 10% | 1% | 13% | 2% | 14% |
Completed/Passed | 78% | 78% | 65% | 94% | 64% |
Incomplete | 2% | 18% | 10% | 0% | 5% |
Ongoing Enrolled | 0% | 0% | 0% | 0% | 0% |
Tested Out | 0% | 0% | 0% | 0% | 0% |
Withdrawn/Exited | 5% | 3% | 9% | 1% | 9% |
Withdrawn/Failing | 1% | 0% | 1% | 0% | 3% |
Withdrawn/Passing | 4% | 0% | 3% | 3% | 5% |
Total | 100% | 100% | 100% | 100% | 100% |
Note: UEP = Unique Education Provider. State School omitted due to limited enrollments.
Back to discussion of Table G2
Table G3. 2024-25 Number and Percentage of Full-Time Virtual Enrollments by Completion Status
Completion Status | # of Enrolls | % of Enrolls |
|---|---|---|
Audited | NR | 0% |
Completed/Failed | 60,060 | 12% |
Completed/Passed | 314,657 | 64% |
Incomplete | 40,973 | 8% |
Ongoing Enrolled | NR | 0% |
Tested Out | NR | 0% |
Withdrawn/Exited | 40,717 | 8% |
Withdrawn/Failing | 11,933 | 2% |
Withdrawn/Passing | 22,415 | 5% |
Total | 490,800 | 100% |
Note: Data are not reported (NR) out of caution for confidentiality.
Back to discussion of Table G3
Table G4. 2024-25 Number and Percentage of Part-Time Virtual Enrollments by Completion Status
Completion Status | # of Enrolls | % of Enrolls |
|---|---|---|
Audited | 1,018 | 0% |
Completed/Failed | 68,858 | 14% |
Completed/Passed | 326,912 | 66% |
Incomplete | 34,887 | 7% |
Ongoing Enrolled | NR | 0% |
Tested Out | NR | 0% |
Withdrawn/Exited | 45,193 | 9% |
Withdrawn/Failing | 4,603 | 1% |
Withdrawn/Passing | 11,992 | 2% |
Total | 493,559 | 100% |
Note: Data are not reported (NR) out of caution for confidentiality.
Back to discussion of Table G4
Table G5. 2024-25 Percentage of Virtual Enrollments by Completion Status and School Emphasis
Completion Status | Alt Ed % of Enrolls | Gen Ed % of Enrolls | Special Ed % of Enrolls |
|---|---|---|---|
Audited | 0% | 0% | 1% |
Completed/Failed | 11% | 14% | 5% |
Completed/Passed | 54% | 73% | 66% |
Incomplete | 16% | 2% | 3% |
Ongoing Enrolled | 0% | 0% | 0% |
Tested Out | 0% | 0% | 0% |
Withdrawn/Exited | 13% | 6% | 19% |
Withdrawn/Failing | 1% | 2% | 3% |
Withdrawn/Passing | 4% | 3% | 3% |
Total | 100% | 100% | 100% |
Note: Reportable Programs and Vocational/CTE are not reported here because each had fewer than 10 schools.
Back to discussion of Table G5
Table G6. 2024-25 Percentage of Virtual Enrollments by Completion Status and Core Subject Area
Completion Status | English % of Enrolls | Math % of Enrolls | Science % of Enrolls | Social Sci % of Enrolls |
|---|---|---|---|---|
Audited | 0% | 0% | 0% | 0% |
Completed/Failed | 14% | 14% | 13% | 13% |
Completed/Passed | 63% | 62% | 64% | 66% |
Incomplete | 8% | 9% | 9% | 8% |
Ongoing Enrolled | 0% | 0% | 0% | 0% |
Tested Out | 0% | 0% | 0% | 0% |
Withdrawn/Exited | 9% | 9% | 9% | 8% |
Withdrawn/Failing | 2% | 2% | 2% | 2% |
Withdrawn/Passing | 4% | 3% | 4% | 3% |
Total | 100% | 100% | 100% | 100% |
Back to discussion of Table G6
Table G7. 2024-25 Percentage of Virtual Enrollments by Completion Status and Student Sex
Completion Status | Females % of Enrolls | Males % of Enrolls |
|---|---|---|
Audited | 0% | 0% |
Completed/Failed | 12% | 14% |
Completed/Passed | 67% | 64% |
Incomplete | 8% | 8% |
Ongoing Enrolled | 0% | 0% |
Tested Out | 0% | 0% |
Withdrawn/Exited | 8% | 9% |
Withdrawn/Failing | 2% | 2% |
Withdrawn/Passing | 3% | 3% |
Total | 100% | 100% |
Back to discussion of Table G7
Table G8. 2024-25 Percentage of Virtual Enrollments by Completion Status and Race / Ethnicity
Completion Status | African American or Black % of Enrolls | American Indian or Alaska Native % of Enrolls | Asian % of Enrolls | Hispanic or Latino % of Enrolls | White % of Enrolls | Two or More Races % of Enrolls | Unknown % of Enrolls |
|---|---|---|---|---|---|---|---|
Audited | 0% | 0% | 0% | 0% | 0% | 0% | 4% |
Completed/Failed | 16% | 13% | 7% | 14% | 12% | 15% | 11% |
Completed/Passed | 59% | 56% | 81% | 59% | 68% | 64% | 49% |
Incomplete | 8% | 14% | 2% | 10% | 7% | 7% | 12% |
Ongoing Enrolled | 0% | 0% | 0% | 0% | 0% | 0% | 0% |
Tested Out | 0% | 0% | 0% | 0% | 0% | 0% | 0% |
Withdrawn/Exited | 10% | 14% | 5% | 11% | 8% | 8% | 20% |
Withdrawn/Failing | 2% | 1% | 1% | 2% | 1% | 3% | 1% |
Withdrawn/Passing | 5% | 3% | 4% | 4% | 3% | 4% | 3% |
Total | 100% | 100% | 100% | 100% | 100% | 100% | 100% |
Note: Only Race / Ethnicities with 1,000 or more students are reported in the table.
Back to discussion of Table G8
Table G9. 2024-25 Number and Percentage of Virtual Enrollments by Completion Status and Poverty Status
Completion Status | In Poverty % of Enrolls | Not In Poverty % of Enrolls | Unknown % of Enrolls |
|---|---|---|---|
Audited | 0% | 0% | 3% |
Completed/Failed | 15% | 9% | 11% |
Completed/Passed | 60% | 77% | 53% |
Incomplete | 9% | 5% | 10% |
Ongoing Enrolled | 0% | 0% | 0% |
Tested Out | 0% | 0% | 0% |
Withdrawn/Exited | 10% | 6% | 19% |
Withdrawn/Failing | 2% | 1% | 1% |
Withdrawn/Passing | 4% | 2% | 3% |
Total | 100% | 100% | 100% |
Back to discussion of Table G9
Table G10. 2024-25 Number and Percentage of Virtual Enrollments by Completion Status and Special Education Status
Completion Status | In Special Ed % of Enrolls | Not In Special Ed % of Enrolls | Unknown % of Enrolls |
|---|---|---|---|
Audited | 0% | 0% | 3% |
Completed/Failed | 17% | 12% | 11% |
Completed/Passed | 59% | 66% | 53% |
Incomplete | 8% | 8% | 10% |
Ongoing Enrolled | 0% | 0% | 0% |
Tested Out | 0% | 0% | 0% |
Withdrawn/Exited | 11% | 8% | 19% |
Withdrawn/Failing | 2% | 2% | 1% |
Withdrawn/Passing | 4% | 3% | 3% |
Total | 100% | 100% | 100% |
Back to discussion of Table G10
Table G11. 2024-25 Percentage of Virtual Enrollments by Completion Status for Students Who Did Not Pass Any of Their Virtual Courses
Completion Status | At Least One % of Enrolls | 11 or More % of Enrolls |
|---|---|---|
Audited | 0% | 0% |
Completed/Failed | 28% | 26% |
Completed/Passed | 0% | 0% |
Incomplete | 17% | 18% |
Ongoing Enrolled | 0% | 0% |
Tested Out | 0% | 0% |
Withdrawn/Exited | 38% | 42% |
Withdrawn/Failing | 6% | 4% |
Withdrawn/Passing | 10% | 9% |
Total | 100% | 100% |
Back to discussion of Table G11
Appendix H - Map Tables
Click on the link below the table to return to the section of the report that discusses the table.
Table H1. 2024-25 Percentage of Students Who Took a Virtual Course (Non-Cyber) by ISD
ISD Name | % of Students in ISD |
|---|---|
Berrien RESA | ≥ 15% of Students |
Alpena-Montmorency-Alcona ESD | ≥ 15% of Students |
Gogebic-Ontonagon ISD | ≥ 15% of Students |
Muskegon Area ISD | ≥ 15% of Students |
West Shore Educational Service District | ≥ 15% of Students |
St. Joseph County ISD | ≥ 15% of Students |
Sanilac ISD | ≥ 15% of Students |
Copper Country ISD | ≥ 15% of Students |
Jackson ISD | ≥ 15% of Students |
Iosco RESA | ≥ 10% to < 15% of Students |
Barry ISD | ≥ 10% to < 15% of Students |
Kalamazoo RESA | ≥ 10% to < 15% of Students |
Calhoun Intermediate School District | ≥ 10% to < 15% of Students |
Heritage Southwest Intermediate School District | ≥ 10% to < 15% of Students |
C.O.O.R. ISD | ≥ 10% to < 15% of Students |
Van Buren ISD | ≥ 10% to < 15% of Students |
Dickinson-Iron ISD | ≥ 10% to < 15% of Students |
Clare-Gladwin Regional Education Service District | ≥ 10% to < 15% of Students |
Bay-Arenac ISD | ≥ 10% to < 15% of Students |
Lapeer ISD | ≥ 10% to < 15% of Students |
Lenawee ISD | ≥ 10% to < 15% of Students |
Genesee ISD | ≥ 10% to < 15% of Students |
Ottawa Area ISD | ≥ 10% to < 15% of Students |
Mecosta-Osceola ISD | ≥ 10% to < 15% of Students |
Charlevoix-Emmet ISD | ≥ 5% to < 10% of Students |
Midland County Educational Service Agency | ≥ 5% to < 10% of Students |
Allegan Area Educational Service Agency | ≥ 5% to < 10% of Students |
Montcalm Area ISD | ≥ 5% to < 10% of Students |
Hillsdale ISD | ≥ 5% to < 10% of Students |
Eastern Upper Peninsula ISD | ≥ 5% to < 10% of Students |
Cheb-Otsego-Presque Isle ESD | ≥ 5% to < 10% of Students |
Ionia ISD | ≥ 5% to < 10% of Students |
Menominee ISD | ≥ 5% to < 10% of Students |
Washtenaw ISD | ≥ 5% to < 10% of Students |
Branch ISD | ≥ 5% to < 10% of Students |
Delta-Schoolcraft ISD | ≥ 5% to < 10% of Students |
Marquette-Alger RESA | ≥ 5% to < 10% of Students |
Tuscola ISD | ≥ 5% to < 10% of Students |
Monroe ISD | ≥ 5% to < 10% of Students |
Oakland Schools | ≥ 5% to < 10% of Students |
Saginaw ISD | ≥ 5% to < 10% of Students |
St. Clair County RESA | ≥ 5% to < 10% of Students |
Kent ISD | ≥ 5% to < 10% of Students |
Gratiot-Isabella RESD | ≥ 5% to < 10% of Students |
Wexford-Missaukee ISD | ≥ 5% to < 10% of Students |
Clinton County RESA | ≥ 5% to < 10% of Students |
Shiawassee Regional ESD | ≥ 5% to < 10% of Students |
Eaton RESA | ≥ 5% to < 10% of Students |
Wayne RESA | ≥ 5% to < 10% of Students |
Ingham ISD | ≥ 5% to < 10% of Students |
Northwest Education Services | ≥ 5% to < 10% of Students |
Newaygo County RESA | ≥ 5% to < 10% of Students |
Huron ISD | ≥ 5% to < 10% of Students |
Livingston ESA | ≥ 5% to < 10% of Students |
Macomb ISD | ≥ 5% to < 10% of Students |
Manistee ISD | < 5% of Students |
Back to discussion of Table H1
Table H2. 2024-25 Number of Cyber Virtual Students By Resident ISD
ISD Name | Number of Students in ISD |
|---|---|
Wayne RESA | ≥ 1,000 PSA Cyber Students |
Macomb ISD | ≥ 1,000 PSA Cyber Students |
Oakland Schools | ≥ 1,000 PSA Cyber Students |
Genesee ISD | ≥ 1,000 PSA Cyber Students |
Ingham ISD | ≥ 1,000 PSA Cyber Students |
Kent ISD | ≥ 500 to < 1,000 PSA Cyber Students |
St. Clair County RESA | ≥ 500 to < 1,000 PSA Cyber Students |
Saginaw ISD | ≥ 500 to < 1,000 PSA Cyber Students |
Muskegon Area ISD | ≥ 200 to < 500 PSA Cyber Students |
Ottawa Area ISD | ≥ 200 to < 500 PSA Cyber Students |
Washtenaw ISD | ≥ 200 to < 500 PSA Cyber Students |
Calhoun ISD | ≥ 200 to < 500 PSA Cyber Students |
Monroe ISD | ≥ 200 to < 500 PSA Cyber Students |
Berrien RESA | ≥ 200 to < 500 PSA Cyber Students |
Kalamazoo RESA | ≥ 200 to < 500 PSA Cyber Students |
Jackson ISD | ≥ 200 to < 500 PSA Cyber Students |
Eaton RESA | ≥ 200 to < 500 PSA Cyber Students |
Northwest Ed Services | ≥ 200 to < 500 PSA Cyber Students |
Bay-Arenac ISD | ≥ 200 to < 500 PSA Cyber Students |
Lenawee ISD | ≥ 200 to < 500 PSA Cyber Students |
Shiawassee Regional ESD | ≥ 200 to < 500 PSA Cyber Students |
Mecosta-Osceola ISD | ≥ 100 to < 200 PSA Cyber Students |
Clare-Gladwin Regional Education Service District | ≥ 100 to < 200 PSA Cyber Students |
Wexford-Missaukee ISD | ≥ 100 to < 200 PSA Cyber Students |
Van Buren ISD | ≥ 100 to < 200 PSA Cyber Students |
Livingston ESA | ≥ 100 to < 200 PSA Cyber Students |
Montcalm Area ISD | ≥ 100 to < 200 PSA Cyber Students |
Cheb-Otsego-Presque Isle ESD | ≥ 100 to < 200 PSA Cyber Students |
C.O.O.R. ISD | ≥ 100 to < 200 PSA Cyber Students |
Tuscola ISD | ≥ 100 to < 200 PSA Cyber Students |
Midland County Educational Service Agency | ≥ 100 to < 200 PSA Cyber Students |
Clinton County RESA | ≥ 100 to < 200 PSA Cyber Students |
Gratiot-Isabella RESD | ≥ 100 to < 200 PSA Cyber Students |
Allegan Area Educational Service Agency | ≥ 100 to < 200 PSA Cyber Students |
Ionia ISD | ≥ 100 to < 200 PSA Cyber Students |
West Shore Educational Service District | ≥ 100 to < 200 PSA Cyber Students |
Lapeer ISD | ≥ 100 to < 200 PSA Cyber Students |
St. Joseph County ISD | ≥ 100 to < 200 PSA Cyber Students |
Heritage SW | ≥ 100 to < 200 PSA Cyber Students |
Eastern Upper Peninsula ISD | ≥ 100 to < 200 PSA Cyber Students |
Sanilac ISD | ≥ 100 to < 200 PSA Cyber Students |
Branch ISD | ≥ 100 to < 200 PSA Cyber Students |
Newaygo County RESA | ≥ 100 to < 200 PSA Cyber Students |
Charlevoix-Emmet ISD | ≥ 100 to < 200 PSA Cyber Students |
Iosco RESA | < 100 PSA Cyber Students |
Marquette-Alger RESA | < 100 PSA Cyber Students |
Dickinson-Iron ISD | < 100 PSA Cyber Students |
Alpena-Montmorency-Alcona ESD | < 100 PSA Cyber Students |
Hillsdale ISD | < 100 PSA Cyber Students |
Gogebic-Ontonagon ISD | < 100 PSA Cyber Students |
Manistee ISD | < 100 PSA Cyber Students |
Huron ISD | < 100 PSA Cyber Students |
Delta-Schoolcraft ISD | < 100 PSA Cyber Students |
Copper Country ISD | < 100 PSA Cyber Students |
Barry ISD | < 100 PSA Cyber Students |
Menominee ISD | < 100 PSA Cyber Students |