Past Effectiveness Reports Michigan’s K-12 Virtual Learning Effectiveness Report 2020-21
Michigan’s K-12 Virtual Learning Effectiveness Report 2019-20
Michigan’s K-12 Virtual Learning Effectiveness Report 2018-19
Michigan’s K-12 Virtual Learning Effectiveness Report 2017-18
Michigan’s K-12 Virtual Learning Effectiveness Report 2016-17
Michigan’s K-12 Virtual Learning Effectiveness Report 2015-16
Michigan’s K-12 Virtual Learning Effectiveness Report 2014-15
Michigan’s K-12 Virtual Learning Effectiveness Report 2013-14
Michigan’s K-12 Virtual Learning Effectiveness Report 2010-11 to 2012-13View InfographicView Benchmarks ResourceWatch Report Overview
Introduction
This report presents an analysis of information on virtual learners reported by schools to the state and shares findings in a highly consumable way to aid the evaluation of virtual learning programs. This year’s report is the tenth edition of this annual publication and completes 12 years of data on K-12 virtual learning in Michigan.
The report is organized into several sections. Each section is meant to capture the essential findings without being overly data intensive; however, data tables have been included in the appendices to provide those interested with more in-depth information. Information about the report’s methodology is captured in Appendix A. Please note that in some tables and figures, the percentage data may not sum to 100% due to rounding.
Schools
Fast Facts
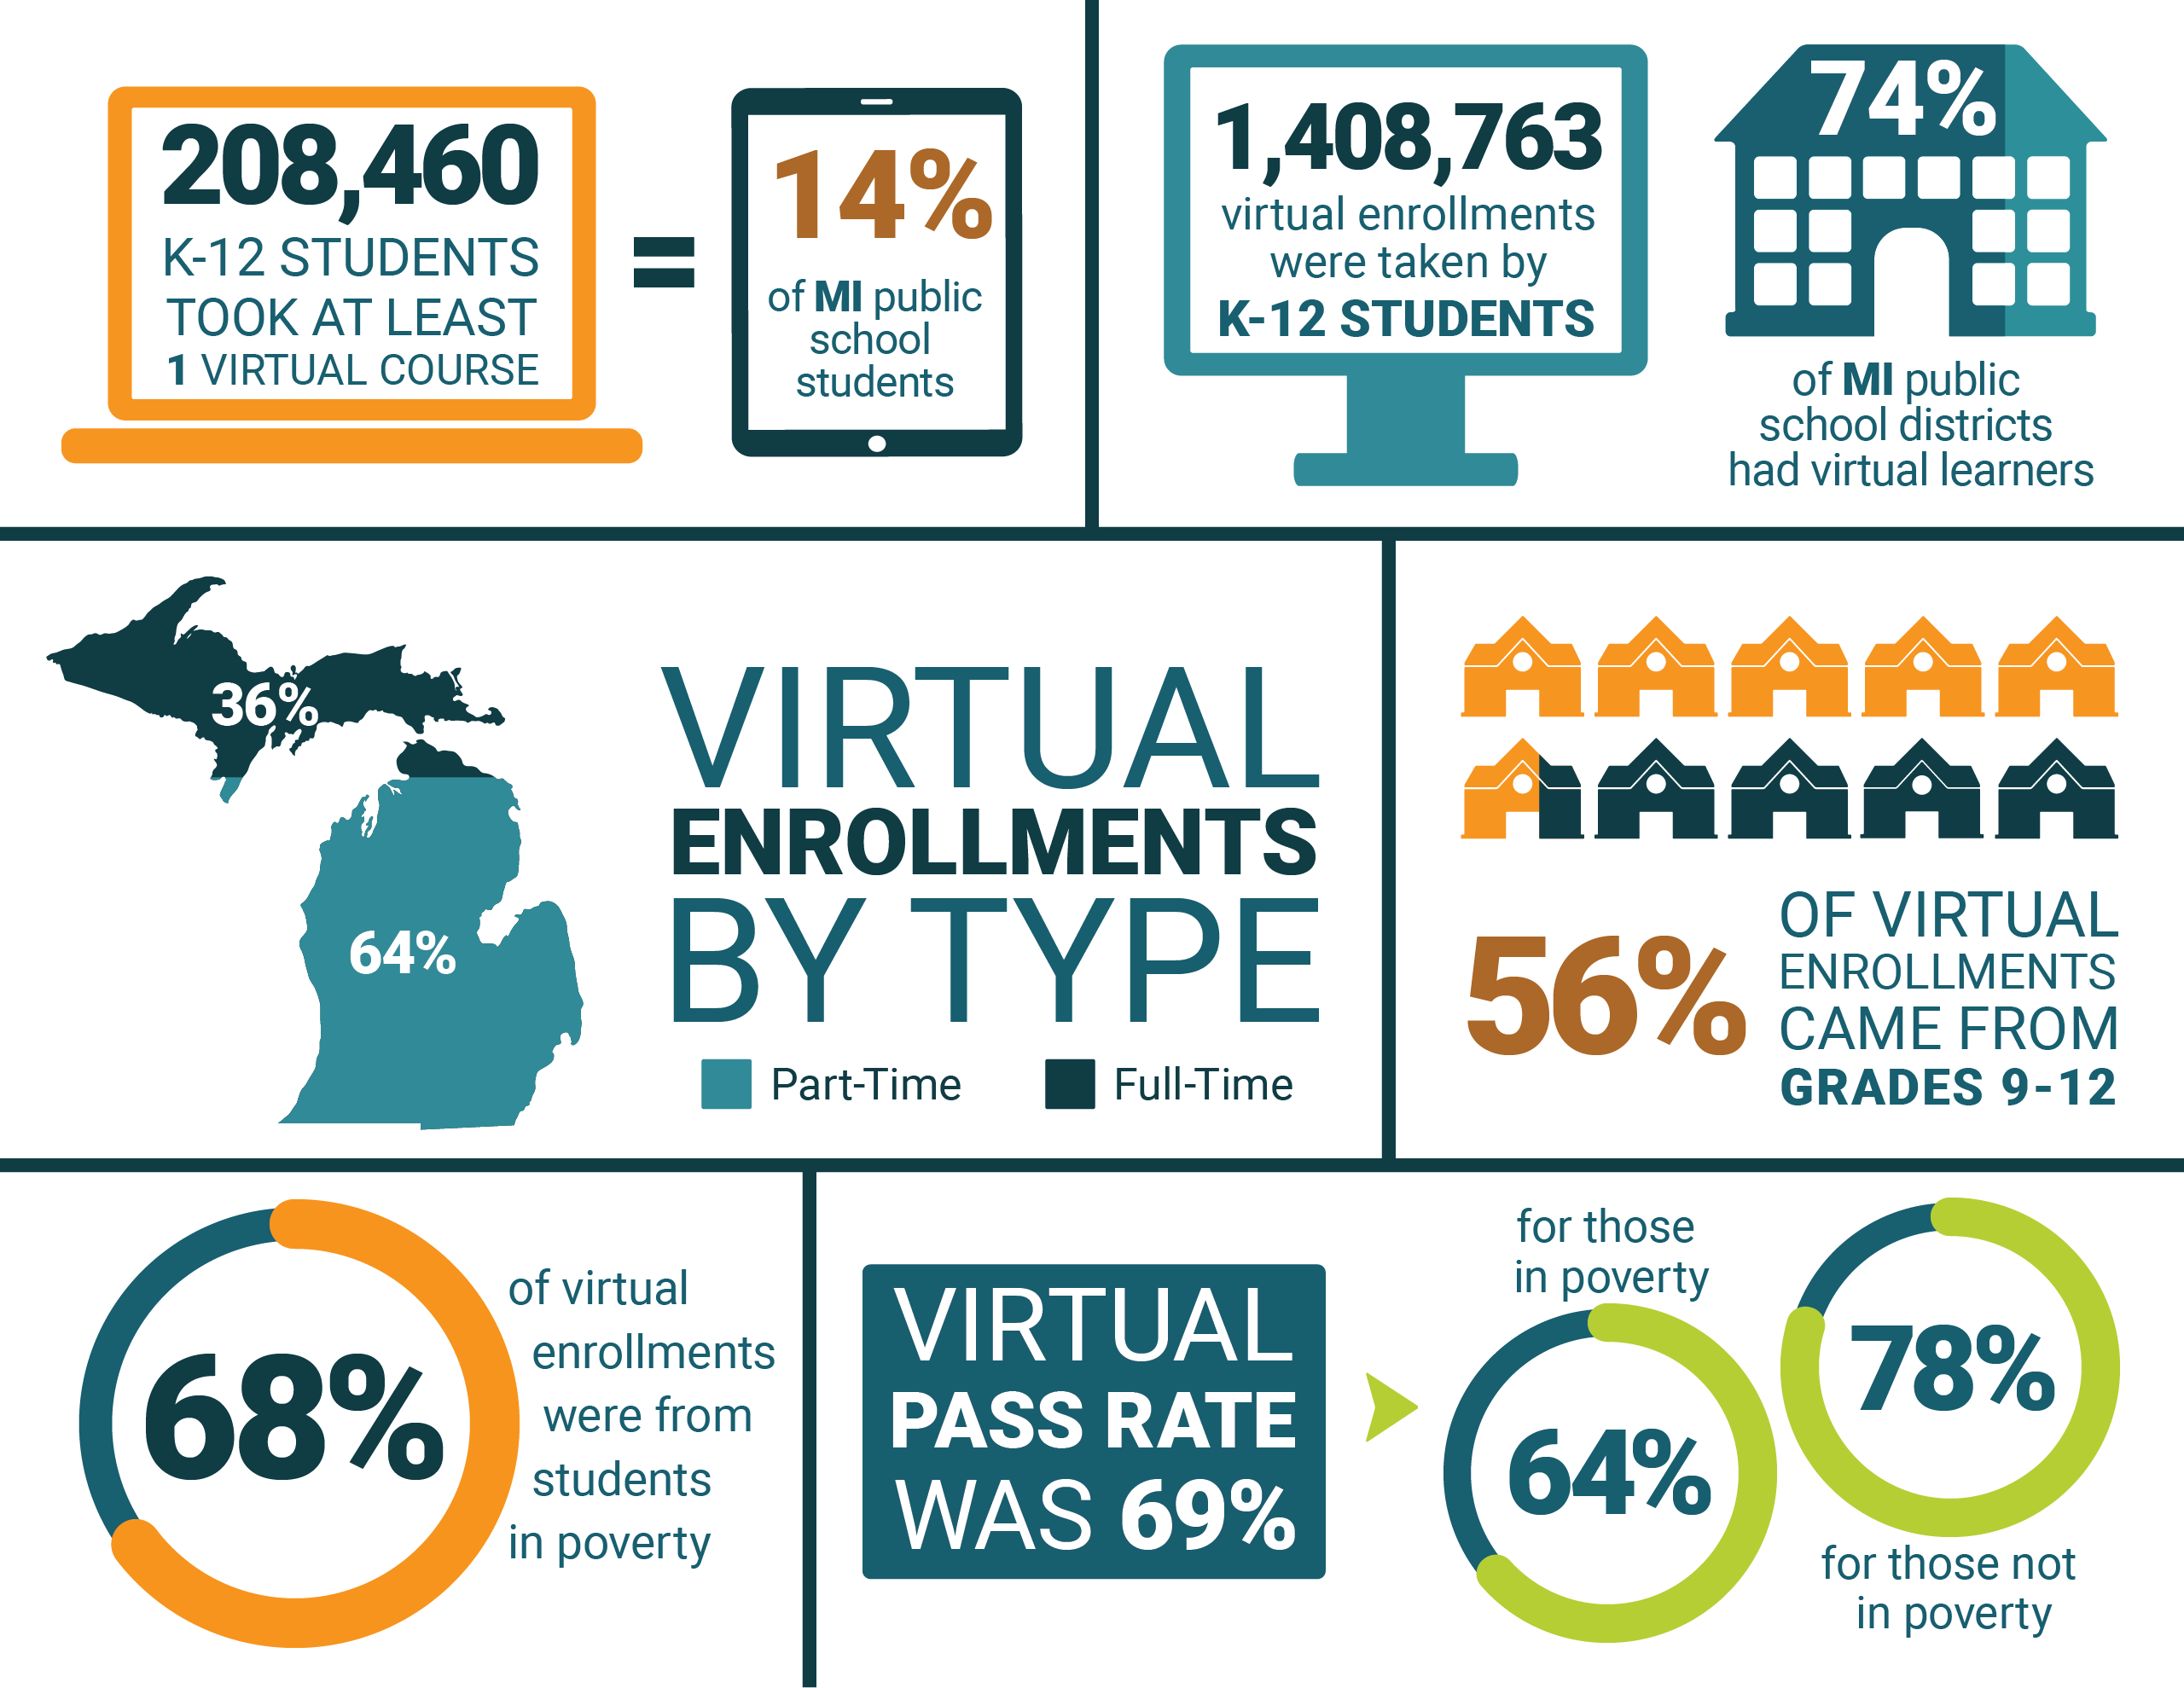
666 school districts reported at least one virtual enrollment. This represented 74% of Michigan school districts.
1,914 schools reported at least one virtual enrollment. This is a 13% decrease compared to last year's record high of 2,207.
16% of this year's schools did not report a virtual enrollment the prior year. These schools added close to 100,000 enrollments with a 65% pass rate.
84% of this year's schools also reported virtual enrollments last year. They accounted for over 1.3M enrollments with a pass rate of 69%.
Roughly 600 schools that offered virtual learning (over 640,000 enrollments) the prior year did not report any for this year.
57% of the 1,914 schools with virtual enrollments had 100 or more virtual enrollments.
84% of schools with virtual enrollments had a general education school emphasis; 14% had an alternative education emphasis.
88% of schools with virtual learning were LEA schools.
LEA schools accounted for 59% of the virtual enrollments; PSA schools generated 40% of the virtual enrollments.
64% of virtual enrollments came from schools with part-time virtual learning options.
LEA schools represented 80% of the full-time virtual schools.
98% of virtual enrollments came from schools with 100 or more virtual enrollments.
56% of virtual enrollments came from students in grades 9-12.
41% of virtual enrollments came from suburban schools, the most of any locale.
Schools with a general education emphasis had a 76% virtual pass rate, outperforming those with an alternative education emphasis, which had a pass rate of 50%.
23% of schools had a school-wide virtual pass rate of 90% to 100%, an increase of three percentage points.
Number of Districts and Schools
For the 2021-22 school year, 666 districts reported having at least one virtual enrollment. This represented 74% of the 897 Michigan public school districts for the year. See the MI School Data Report for a breakdown of the district count.
Within those districts, 1,914 schools reported virtual enrollments, 293 fewer than the prior year. Of the 2,207 schools reporting virtual enrollments in 2020-2021 (the prior year), 594 of them (27%) did not report any virtual enrollments in 2021-2022 (this year). Those schools accounted for a total of 643,497 virtual enrollments in 2020-2021. There were also 301 schools that reported virtual enrollments in 2021-2022 but had not reported any the prior year. These schools added almost 100,000 virtual enrollments this year and had a virtual pass rate of 65%. That means 84% (1,613) of schools in this year's dataset reported virtual enrollments in both 2020-21 and 2021-2022. These schools generated over 1.3M enrollments and had a pass rate of 69%, which was four percentage points lower than their rate in 2020-21. See Table B1. Over 280,000 of those enrollments came from 39 schools that reported 1,000 or more enrollments than they did in 2020-21. On the other hand, 451 schools reported decreases of 1,000 or more virtual enrollments this year. Even with these declines, these schools yielded over 440,000 virtual enrollments this year. See Table B2. These findings seem to point to the continued volatility due to the pandemic. Close to three in 10 schools in both years saw their pass rates increase by 10 percentage points or more from the prior year. See Table B3.
By Grade Level
Across the 1,914 schools, 1,408,763 virtual enrollments were provided. Students in 12th grade generated the most virtual enrollments (270,455), representing approximately 19% of all virtual enrollments. There continued to be a larger percentage of elementary and middle school virtual enrollments than before the pandemic. In the 2019-20 school year, 81% of the virtual enrollments came from students in high school; in 2020-21, that figure dropped to 40%. This year, the percentage of high school enrollments rebounded to reflect 56% of virtual enrollments. Barring another round of face-to-face school closures, it seems likely that this percentage will continue moving upward over the next several years.
The overall pass rate for virtual enrollments was 69%, a decrease of 5 percentage points over the prior year. See Table G1 for a more specific breakdown of all the completion statuses. This ranged from a high of 88% in second grade to a low of 49% in 9th grade. Interestingly, elementary grades tended to see small increases (two to five percentage points) whereas the high school grades saw decreases of 10, six, five, and two percentage points for grades 9-12, respectively. See Table B4 for more information.
The 2020-21 school year saw a break from the norm where virtual learners passed their virtual courses at a higher rate (74%) than they passed their non-virtual courses (73%). This year, we saw it revert back to past years. For 2021-22, virtual learners had a 69% pass rate in their virtual courses, but a 71% pass rate for their non-virtual coursework. See Table B5. As an additional point of comparison, the 2019-20 school year virtual pass rate was 12 percentage points lower than those students' non-virtual pass rate.
By School-Level Virtual Pass Rate
Of the 1,914 schools with virtual enrollments, 443 or 23% had school-level virtual pass rates of 90% to 100%. This was three percentage points higher than the prior year. Fifty-three percent of the schools (1,007) had virtual pass rates of 70% or higher. This was three percentage points higher than the prior year. See Table B6. Thus, even though the overall pass rate in the state dropped year over year, a higher percentage of schools experienced high levels of student performance.
By Entity Type
LEA schools and PSA schools accounted for almost all the virtual enrollments with 59% and 40%, respectively. This was very similar to pre-pandemic rates. Virtual enrollments came from 1,685 (88%) LEA schools while only 184 (10%) of the schools were PSAs. See Table B7. LEA schools had a lower pass rate (65%) than PSA schools (74%), for the second straight year. See Table B8 or, for a more in-depth look at the completion statuses, see Table G2.
By Full-Time Virtual Schools
The number of full-time virtual schools (94) decreased by seven from the prior year. Seventy-five of the 94 full-time virtual schools (80%) were LEA schools. PSA schools (17) accounted for 18% of the full-time virtual schools. See Table B9. Despite the sizable difference in the number of schools, PSAs reported more virtual enrollments (56%) from full-time virtual students statewide compared to LEAs (43%). PSA full-time virtual learners saw higher virtual pass rates (61%) than their counterparts in LEA schools (57%). See Table B10 and Table G3. Overall, the number of virtual enrollments from full-time virtual schools grew from 429,164 in 2020-21 to 502,284 this year. Thirty-six percent of the virtual enrollments came from full-time virtual learners.
A quick note about full-time virtual schools: Historically, full-time virtual schools have only provided students with 100% of their learning online. Thus, it was safe to designate all enrollments from such a school as being part of a full-time virtual program. Over the last few years, however, LEAs have started to add full-time virtual options to their offerings. In some cases, this is as a separate school, which makes it analogous to the cyber schools. However, increasingly, it seems that schools are offering multiple forms of online learning from the same building code. This can be seen in the Education Entity Master where schools can report educational settings including “Full Virtual,” “Face Virtual,” and “Supplemental Virtual.” See page 16 of the Educational Entity Master Glossary for more information on these field values. This means that some schools report various forms of virtual (and sometimes non-virtual) learning from a single building code. Case in point, 10% of the enrollments from virtual learners in LEA full-time programs were not flagged as being delivered virtually, indicating what may be more of a hybrid approach.
By Part-Time Virtual Schools
About 95% of the schools offering virtual learning do so to supplement their face-to-face course offerings. These 1,820 schools, referred to in this report as part-time virtual schools, were predominantly LEA schools (88%). See Table B11. Seventy-seven percent of the part-time virtual students were enrolled through LEA schools and 22% through PSA schools. LEA schools accounted for over 600,000 virtual enrollments or 67% of the part-time enrollments. In total, enrollments from part-time virtual schools accounted for 64% of all the virtual enrollments for the year. LEA schools had a pass rate of 67% whereas PSA schools had a pass rate of 87%. Overall, the pass rate for the part-time virtual schools (74%) was 15 percentage points higher than the rate for the full-time virtual schools (59%). See Table B12 and Table G4.
By School Emphasis
Eighty-four percent of schools with virtual learning were designated as General Education and produced over 1M (72%) of the virtual enrollments. Schools with Alternative Education as their emphasis accounted for almost 400,000 (28%) of the virtual enrollments. See Table B13. There was a considerable difference in virtual pass rates between these two types of schools. General Education schools had a 76% virtual pass rate, whereas Alternative Education schools had a 50% virtual pass rate (see Table B14 and Table G5), though this varied by entity type. LEA schools, for instance, had a 72% virtual pass rate for General Education schools and a 51% virtual pass rate for Alternative Education schools. See Table B15.
By Number of Virtual Enrollments
Fifty-seven percent of schools with virtual enrollments had 100 or more virtual enrollments. These schools were responsible for 98% of the virtual enrollments (1,380,335). See Table B16.
Another trend that continued was that, in general, schools with fewer virtual enrollments per student performed better. Consider, for instance, that 35% of schools with an average of one to two virtual enrollments per virtual learner had a virtual pass rate of 90% to 100%, whereas only 21% of schools with an average of five or more virtual courses per virtual learner had a 90% to 100% pass rate. See Table B17.
By Locale
Suburban schools represented 36% of schools with virtual enrollments. Rural settings provided the second most schools with 31%. Suburban schools also tallied the largest percentage of the virtual enrollments at 41%. Rural schools were the next closest providing 26% of the enrollments. See Table B18. In each of the four locales, schools with 100 or more virtual enrollments accounted for the largest percentage of schools. See Table B19. Virtual pass rates varied by locale with City schools having the highest virtual pass rate at 71% and Town schools having the lowest at 61%. See Table B20. Suburban schools had 44% of their schools achieve building-wide virtual pass rates of 80% or higher. The next closest were Rural schools with 38% achieving building-wide virtual pass rates of 80% or higher. See Table B21. For more information about locales, including definitions, please see pages 24-25 of the Educational Entity Master Glossary.
By School Free or Reduced-Price Lunch Categories
Schools were categorized into one of four categories based on the percentage of all learners at the school (not just virtual learners) that qualified for free or reduced-price (FRL) meals:
Low FRL (<=25%)
Mid-Low FRL (>25% to <=50%)
Mid-High FRL (>50% to <=75%)
High FRL (>75%)
From this perspective, all categories had over half of its schools report virtual learners. Mid-Low FRL had the highest percentage at 59%. See Table B22.
While High FRL schools represented only 25% of schools with virtual programs (486), they accounted for 43% of the virtual enrollments. Mid-High FRL schools accounted for 30% of the enrollments. Low FRL schools, on the other hand, reported only 7% of the virtual enrollments. The virtual pass rate for Low FRL schools was 84% compared to 64% for Mid-High FRL and High FRL schools. See Table B23.
Courses
Fast Facts
Over 1.4M virtual enrollments were taken by Michigan K-12 students; the overall pass rate for virtual enrollments was 69%.
Virtual enrollments were spread across 1,097 different course titles.
64% of virtual enrollments occurred in the core subject areas of English Language and Literature, Mathematics, Life and Physical Sciences, and Social Sciences and History.
The course titles with the highest enrollments for each core subject were:
English Language and Literature: English 9, English 10, English 11, and English 12
Mathematics: Geometry, Algebra I, Algebra II, and Consumer Mathematics
Life and Physical Sciences: Biology, Chemistry, Earth Science, and Physical Science
Social Sciences and History: U.S. History—Comprehensive, World History and Geography, Economics, and World History—Overview
Number of Courses
The 1,408,763 virtual enrollments came from 1,097 different course titles, as determined by unique SCED codes.
Courses by Subject Area
English Language and Literature was the subject area with the highest number of virtual enrollments (253,201)---18% of all virtual enrollments. Mathematics, Social Sciences and History, and Life and Physical Sciences were the other subject areas with 10% or more of the virtual enrollments. In high enrollment subject areas (greater than 100,000 virtual enrollments), virtual pass rates varied from a low of 63% in Mathematics to a high of 79% for Fine and Performing Arts as well as Miscellaneous. See Table C1 and Table G6. Nine of the 23 subject areas (including all four core subjects) had virtual pass rates that were equal to or greater than the non-virtual pass rates for these students; there were 15 the prior year, but that, too, was a change from past trends. See Table C2.
Highest Virtual Enrollment Courses
For English Language and Literature, the most highly enrolled in virtual courses were 9th, 10th, 11th, and 12th grade English/Language Arts. Of those four, the pass rate was lowest for 9th grade English/Language Arts (47%) and rose consistently for each subsequent grade level to finish at 65% for 12th grade English/Language Arts. Three course titles were at the 6-8 grade level and another three were K-5. See Table C3.
In Mathematics, Geometry, Algebra I, and Algebra II had the most enrollments, each having over 30,000. Middle school Mathematics courses tended to have around 10,000 to 12,000 enrollments. The pass rate across the top 10 most enrolled-in virtual mathematics courses ranged from a low of 45% for Algebra I to a high of 87% in Mathematics (grade 1). See Table C4.
Biology (37,187) and Chemistry (22,885) were the only course titles responsible for more than 10% of the virtual enrollments in Life and Physical Sciences courses. Three others, Earth Science, Physical Science, and Science (grade 7) had more than 10,000 enrollments. Biology had the lowest pass rate (53%) of those in the top 10; the highest was 82% in Science (grade 3). See Table C5.
For Social Sciences and History, only U.S. History–Comprehensive (26,249) yielded more than 10% of the virtual enrollments. Five other titles had more than 10,000 enrollments. Pass rates for the top 10 most enrolled in courses ranged from a low of 51% in World History and Geography to a high of 75% in Social Studies (grade 6). See Table C6.
Thirty-six AP courses were taken virtually in 2021-22. There were 5,300 virtual AP enrollments, a stark contrast from the prior year's record high of 26,888. AP Psychology was the most popular course accounting for 16% of the enrollments. The pass rate for AP courses taken virtually was 84%. See Table C7. The pass rate for non-virtual AP courses taken by virtual learners was 91%.
Subject Area Enrollments by Locale
Course enrollment patterns were quite consistent across locales. For instance, each locale (Rural, Town, Suburb, City, and Not Specified) reported 14% of their enrollments in Life and Physical Sciences. In English Language and Literature, along with Mathematics, the difference across the locales was within a few percentage points. See Table C8. Pass rates in virtual courses did vary across subject areas and locale. For instance, in English Language and Literature, the Town pass rate was 60% while the pass rate from City schools was 68%. This trend of Town schools lagging behind the performance of students in other locales was also true for the other core subjects of Mathematics, Life and Physical Sciences, and Social Sciences and History. See Table C9.
Subject Area Enrollments by Student Sex
Males and females enrolled in subject areas in similar proportions. In the four highest enrollment subject areas (English Language and Literature, Mathematics, Life and Physical Sciences, and Social Sciences and History), the proportion of enrollment from males and females was within one percent of each other. Pass rates did, however, show more variability by student sex. In 19 of the 23 subject areas, females outperformed males---a trend that has been consistent with past years. Females had a 69% pass rate whereas males had a 68% pass rate. See Table C10.
Courses by Virtual Method
Schools classified the virtual courses into one of three methods: Blended Learning, Digital Learning, or Online Learning. See pages 354 and 355 of the Michigan Student Data System Collection Details Manual Version 3.0.
Blended Learning - A hybrid instructional delivery model where pupils are provided content, instruction, and assessment at a supervised educational facility where the pupil and teacher are in the same physical location and in part through internet-connected learning environments with some degree of pupil control over time, location and pace of instruction. For a course to be considered blended, at least 30% of the course content is delivered online.
Digital Learning - A course of study that is capable of generating a credit or a grade that is provided in an interactive internet-connected learning environment that does not contain an instructor within the online environment itself. There may be a teacher of record assigned to the course, but this teacher does not provide instruction to students through the online environment. For a course to be considered online as opposed to blended, all (or almost all) the course content is delivered online.
Online Course - A course of study that is capable of generating a credit or a grade that is provided in an interactive internet-connected learning environment, where pupils are separated from their teachers by time or location, or both. For a course to be considered online as opposed to blended, all (or almost all) the course content is delivered online.
Blended Learning enrollments accounted for 22% of the virtual enrollments and had a pass rate of 89%. Digital Learning totaled 7% of the enrollments with a 59% pass rate. Online courses represented most of the enrollments (71%) and yielded a pass rate of 63%. See Table C11.
Students
Fast Facts
Over 208,000 K-12 students took at least one virtual course which represented 14% of Michigan public school students.
Elementary and middle school students each tended to reflect about 4% to 5% of students per grade; high school students reflected 11% to 22% per grade.
56% of virtual learners passed all their virtual courses. 17% of virtual learners did not pass any of their virtual courses.
Of the over 35,000 students who did not pass any of their virtual courses, 36% took only one or two courses. About half of these students took and did not pass five or more virtual courses, and fourteen percent took and did not pass 11 or more virtual courses.
Female students had a slightly higher pass rate (69%) than did males (68%).
Students in poverty made up the majority of virtual learners (63%) and virtual enrollments (68%). Students in poverty also had a lower pass rate (64% v. 78%).
Part-time virtual learners had higher pass rates (74%) compared to full-time virtual learners (59%).
Students using special education services made up 13% of the virtual learners.
Pass rates were highest for students taking the fewest virtual courses. Students taking one to two virtual courses had a pass rate of 77% whereas students taking three to four and those taking five or more each had virtual pass rates of 68%.
White students represented 56% of virtual students; African American or Black students were 25%. This means that White students were underrepresented, and African American or Black students were overrepresented compared to their percentages in the statewide student population.
Over 1.2M virtual enrollments were from students whose district was stable (all enrollments from the same district) throughout the year. These enrollments had a virtual pass rate of 74%.
By Grade Level
For the 2021-22 school year, 208,460 Michigan K-12 students, approximately 14% of students in the state, took at least one virtual course. This was about half the number of students compared to the prior year (418,513). Sixty-three percent of virtual learners came from the high school grades. Each of the elementary and middle school grade levels tended to be around 4% to 5% of the virtual learners with each of the high school grade levels between 11% to 22%. See Table D1.
By Student Sex
There were slightly more females (105,223) enrolled in virtual courses than males (103,259), though from a percentage perspective, each represented about half of the population. Females had a 1% higher pass rate (69% compared to males at 68%), continuing the trend seen in past years of females outperforming their male counterparts on this measure. See Table D2 and Table G7.
By Race/Ethnicity
White students made up 56% of virtual students with African American or Black students totaling the second highest percentage with 25%. Asian students had the highest pass rate at 89%. See Table D3 and Table G8. This means that White students were underrepresented (as they made up 64% of students in the state for the year), and African American or Black students were overrepresented (as they reflected 18% of the statewide student population). See Student Enrollment Count Report.
By Poverty Status
Sixty-three percent of virtual learners were classified as living in poverty. This is only one percentage point lower than the prior year and 11 percentage points higher than the percentage of K-12 students statewide who were economically disadvantaged. See Student Enrollment Count Report. Students living in poverty took 68% of the virtual enrollments for the year. The pass rate for students in poverty (64%) was 14 percentage points lower than students who were not in poverty (78%). See Table D4 and Table G9. In 2020-21, the performance gap was 13 percentage points.
Prior to the pandemic, the data consistently showed that students in poverty performed better in their non-virtual courses. The 2020-21 school year deviated from that pattern. This year (2021-22), we saw for the second year in a row that students in poverty had a higher pass rate in their virtual courses (64%) than they did in their non-virtual courses (62%). Students not in poverty performed better in their non-virtual courses (by six percentage points). See Table D5.
Seventy-one percent of full-time virtual learners were in poverty compared to 61% for part-time virtual learners. The pass rate for full-time virtual learners in poverty was 55% compared to 70% for part-time virtual learners. See Table D6.
To get a sense of how the poverty level of schools might impact virtual learning patterns, we categorized schools into one of four categories based on the percentage of all learners at the school (not just virtual learners) that qualified for free or reduced-price (FRL) meals:
Low FRL (<=25%)
Mid-Low FRL (>25% to <=50%)
Mid-High FRL (>50% to <=75%)
High FRL (>75%)
About 8% of all Michigan K-12 students who attended Low FRL schools were virtual learners. Twelve percent of the state’s students in Mid-Low FRL, and 16% of those in Mid-High FRL schools were virtual learners. Twenty-four percent of students in High FRL schools took virtual courses in the 2021-2022 school year. See Table D7.
By Special Education Status
Students using special education services made up 13% of the virtual learners and 13% of the virtual enrollments. These percentages are similar to the statewide percentage of students using special education services (13%) for the 2021-22 school year. See the Student Enrollment Counts Report. Students using special education services had a virtual pass rate of 64% compared to 69% for those who did not. See Table D8 and Table G10.
A new table in this year's report, Table D9, shows how virtual enrollments varied by a students' primary disability. Almost 10,000 students had "Specific Learning Disability" listed as their primary disability. This translated to 37% of the virtual learners receiving special education services. The second largest group were students with a Speech & Language Impairment. This group represented 14% of virtual learners receiving special education services. Students with Speech & Language Impairment also had the highest virtual pass rate at 84%. See Table D9.
Table D10, also a new table, shows how the percentage of virtual learners using special education services by primary disability compares to the overall state rates. For instance, only about five percent of the states' students with an IEP have "Emotional Impairment" listed as their primary disability. However, 28% of those students ended up taking at least one virtual course in 2021-22. These two new tables can assist in tracking how virtual learning is being used to target specific disabilities and how well performance follows.
By Home-School / Nonpublic Student Status
Another new table in this year's report shows virtual learning data for home-schooled and nonpublic students enrolling in a public school to augment their education. There are just over 4,500 such students, and this group of students generated over 20,000 virtual enrollments. These students had a 94% virtual pass rate. See Table D11.
By Full-Time or Part-Time
Twenty-five percent of students (52,198) were enrolled in cyber or full-time virtual schools. Students in these schools accounted for 502,284 or 36% of the virtual enrollments for the year. The pass rate for full-time virtual students was 59%. Three out of four virtual learning students were part-time virtual learners, taking some courses virtually to supplement their face-to-face schedule. This subset made up 64% of the virtual enrollments and had a pass rate of 74%. See Table D12. The 74% virtual pass rate was three percentage points higher than the non-virtual pass rate for these students. See Table D13.
Another way to conceptualize full/part time status is to look at the percentage of a student's enrollments that were delivered virtually. There was a large number of students (98,973) that had 75% or more of their enrollments reported as being delivered virtually. That student count is roughly double the number of students who attended cyber or full-time virtual schools. Examination of pass rates showed students who had fewer than 25% of their enrollments delivered virtually and those who had 75% or more of their enrollments delivered virtually, outperformed the students in the middle two quartile groupings. See Table D14. Table D15 and Table D16 show how the percentage of students, enrollments, and pass rates changed for LEA schools and PSA schools, respectively.
By Mobility Status
For the second consecutive year, mobility data were included as part of the data set. The mobility variable included the following statuses: stable, incoming, or outgoing. Some of the enrollments did not include information on this variable and were listed in the data tables as "Missing." More information about this variable is available on the MI School Data Student Mobility page.
When it came to district stability, over 1.2M (86%) of the virtual enrollments were classified as stable. The pass rate for stable enrollments was 74%. Incoming enrollments to a district represented 4% of the virtual enrollments and had a pass rate of 49%. See Table D17.
When looking at mobility from a poverty perspective, we get a more nuanced picture. Eighty-five percent of virtual enrollments from students in poverty were stable compared to 92% for students who were not in poverty. The pass rate for stable, in poverty enrollments was 70% but rose to 82% for stable, not in poverty enrollments. For incoming virtual enrollments, there was an eight-percentage point advantage for students who were not in poverty (47% v. 55%). See Table D18.
Looking at mobility from a locale perspective showed somewhat similar virtual enrollment percentages across geographies. Town schools had the lowest percentage of stable enrollments at 81%. Rural schools were next at 85%. City schools reported 87% of their enrollments as stable. Suburban schools reported the highest percentage of stable virtual enrollments with 88%. See Table D19. Virtual pass rates showed a similar pattern. Stable enrollments from Town schools had a 67% pass rate whereas the pass rate was 76% for City schools. The incoming pass rates tended to lag the stable pass rates by 20 to 30 percentage points regardless of the locale. See Table D20.
A final mobility dimension explored was how enrollment and performance varied across full-time and part-time virtual schools. Full-time virtual or cyber schools had a lower percentage of their virtual enrollments designated as stable (80% v. 90%). The full-time pass rate for stable enrollments also lagged that of students from part-time virtual programs (66% v. 77%). See Table D21.
By Non-Virtual Course Performance
Part-time virtual learners with at least three non-virtual courses were classified into one of three categories based on their success in those non-virtual courses. The three categories were:
Passed all Non-Virtual Courses
Did Not Pass 1 or 2 Non-Virtual Courses
Did Not Pass 3 or More Non-Virtual Courses
In total, 69% of part-time virtual learners had at least three or more non-virtual enrollments. Of that group, 42% of students passed all their non-virtual courses, 18% did not pass one or two, and 40% did not pass three or more. There were clear differences in virtual pass rates between the three categories. Students passing all their non-virtual courses had a 78% virtual pass rate. Students who did not pass one or two non-virtual courses had a virtual pass rate of 68%, and those with the lowest non-virtual success had a virtual pass rate of only 46%. See Table D22.
By Virtual Course Performance
Fifty-six percent of virtual learners passed every virtual enrollment they took. This was one percentage point higher than the prior year. Seventeen percent did not pass any of their virtual enrollments, and 27% passed some, but not all their virtual enrollments. Students who passed all their virtual courses were responsible for 48% of the virtual enrollments. Students with mixed success generated 39% of the enrollments, and students who did not pass any of their virtual courses contributed 13% of the virtual enrollments (compared to 11% in 2020-21). See Table D23.
For the students who did not pass any of their virtual courses, 36% only took one or two virtual courses. On the other hand, over 18,000 students did not pass five or more virtual courses, and over 5,000 students did not pass 11 or more virtual courses. See Table D24 and Table G11. Further analysis of students failing all their 11 or more virtual courses showed 90% of these students had a single school report data for them. Over half of these students came from part-time virtual programs. Over 850 students were using special education services (17%) and 4,046 of these students (80%) were in poverty.
What Table G11 makes clear is that for students who do not pass any of their virtual enrollments, “withdrawns” were rampant. For the virtual enrollments from students who did not pass any of their virtual enrollments, 48% had a “Withdrawn” status (exited, failing, or passing), and another 17% were classified as “Incomplete.” For those taking 11 or more virtual courses, 38% had a “Withdrawn” status and 23% were marked “Incomplete.” In each case, 35% and 39% of the virtual enrollments, respectively, were actually classified as “Completed/Failed.” Please see the section on Pass Rate Calculations for more elaboration on the impact of such issues on pass rates.
By Virtual Usage
In a return to pre-pandemic trends, virtual learners had the highest pass rates when they took one or two virtual courses. Students taking one to two virtual courses had a pass rate of 77% compared to a pass rate of 68% for those taking three to four virtual courses and a pass rate of 68% for students taking five or more virtual courses. About 30% of students fell under the description of taking one or two virtual courses; however, 59% were found to have taken five or more virtual courses during the year. See Table D25.
State Assessment
Fast Facts
40% of 11th grade virtual learners who took the SAT scored proficient in the Reading/Writing component. 19% tested proficient in Math.
Higher proficiency rates on state assessments were seen with higher non-virtual performance and with students who were not in poverty.
A higher percentage of part-time virtual learners reached levels of proficiency on state assessment measures than their full-time counterparts.
By Subject Area
State assessment data can be used to provide an independent measure of student performance. Based on SAT and M-STEP data from students in 11th grade, virtual learners showed lower percentages reaching proficiency on the Evidence-Based Reading and Writing (SAT), Mathematics (SAT), Science (M-STEP) and Social Studies (M-STEP) examinations than the statewide proficiency rates. Forty percent of the 11th grade virtual learners tested proficient in Evidence-Based Reading and Writing, and 19% were proficient in Mathematics. For Science, 31% tested proficient whereas Social Studies had 27% of the virtual learners reach proficiency. See Table E1.
By Non-Virtual Performance
As expected, the percentage of virtual learners testing proficient on these state tests varied considerably when accounting for their non-virtual performance. For instance, students taking a minimum of three non-virtual courses and passing all of them had proficiency rates that exceeded the statewide average for each assessment. Students who did not pass one or two of their non-virtual courses and those not passing three or more of their non-virtual courses had much lower rates of proficiency. See Table E2.
By Poverty Status
Students in poverty consistently recorded proficiency rates that were considerably lower than their peers who were not in poverty. As examples, 26% of virtual learners in poverty scored proficient on the Evidence-Based Reading and Writing exam compared to 56% for those who were not in poverty. For Mathematics, only 8% of virtual learners in poverty scored proficient compared to 31% for those not in poverty. See Table E3.
By Full- or Part-Time Type
Students taking virtual courses in a part-time capacity had higher rates of proficiency on the assessments compared to full-time virtual learners. For some assessments, the gap was sizable; 12 percentage points for Mathematics and nine points for Evidence-Based Reading & Writing. See Table E4.
Maps
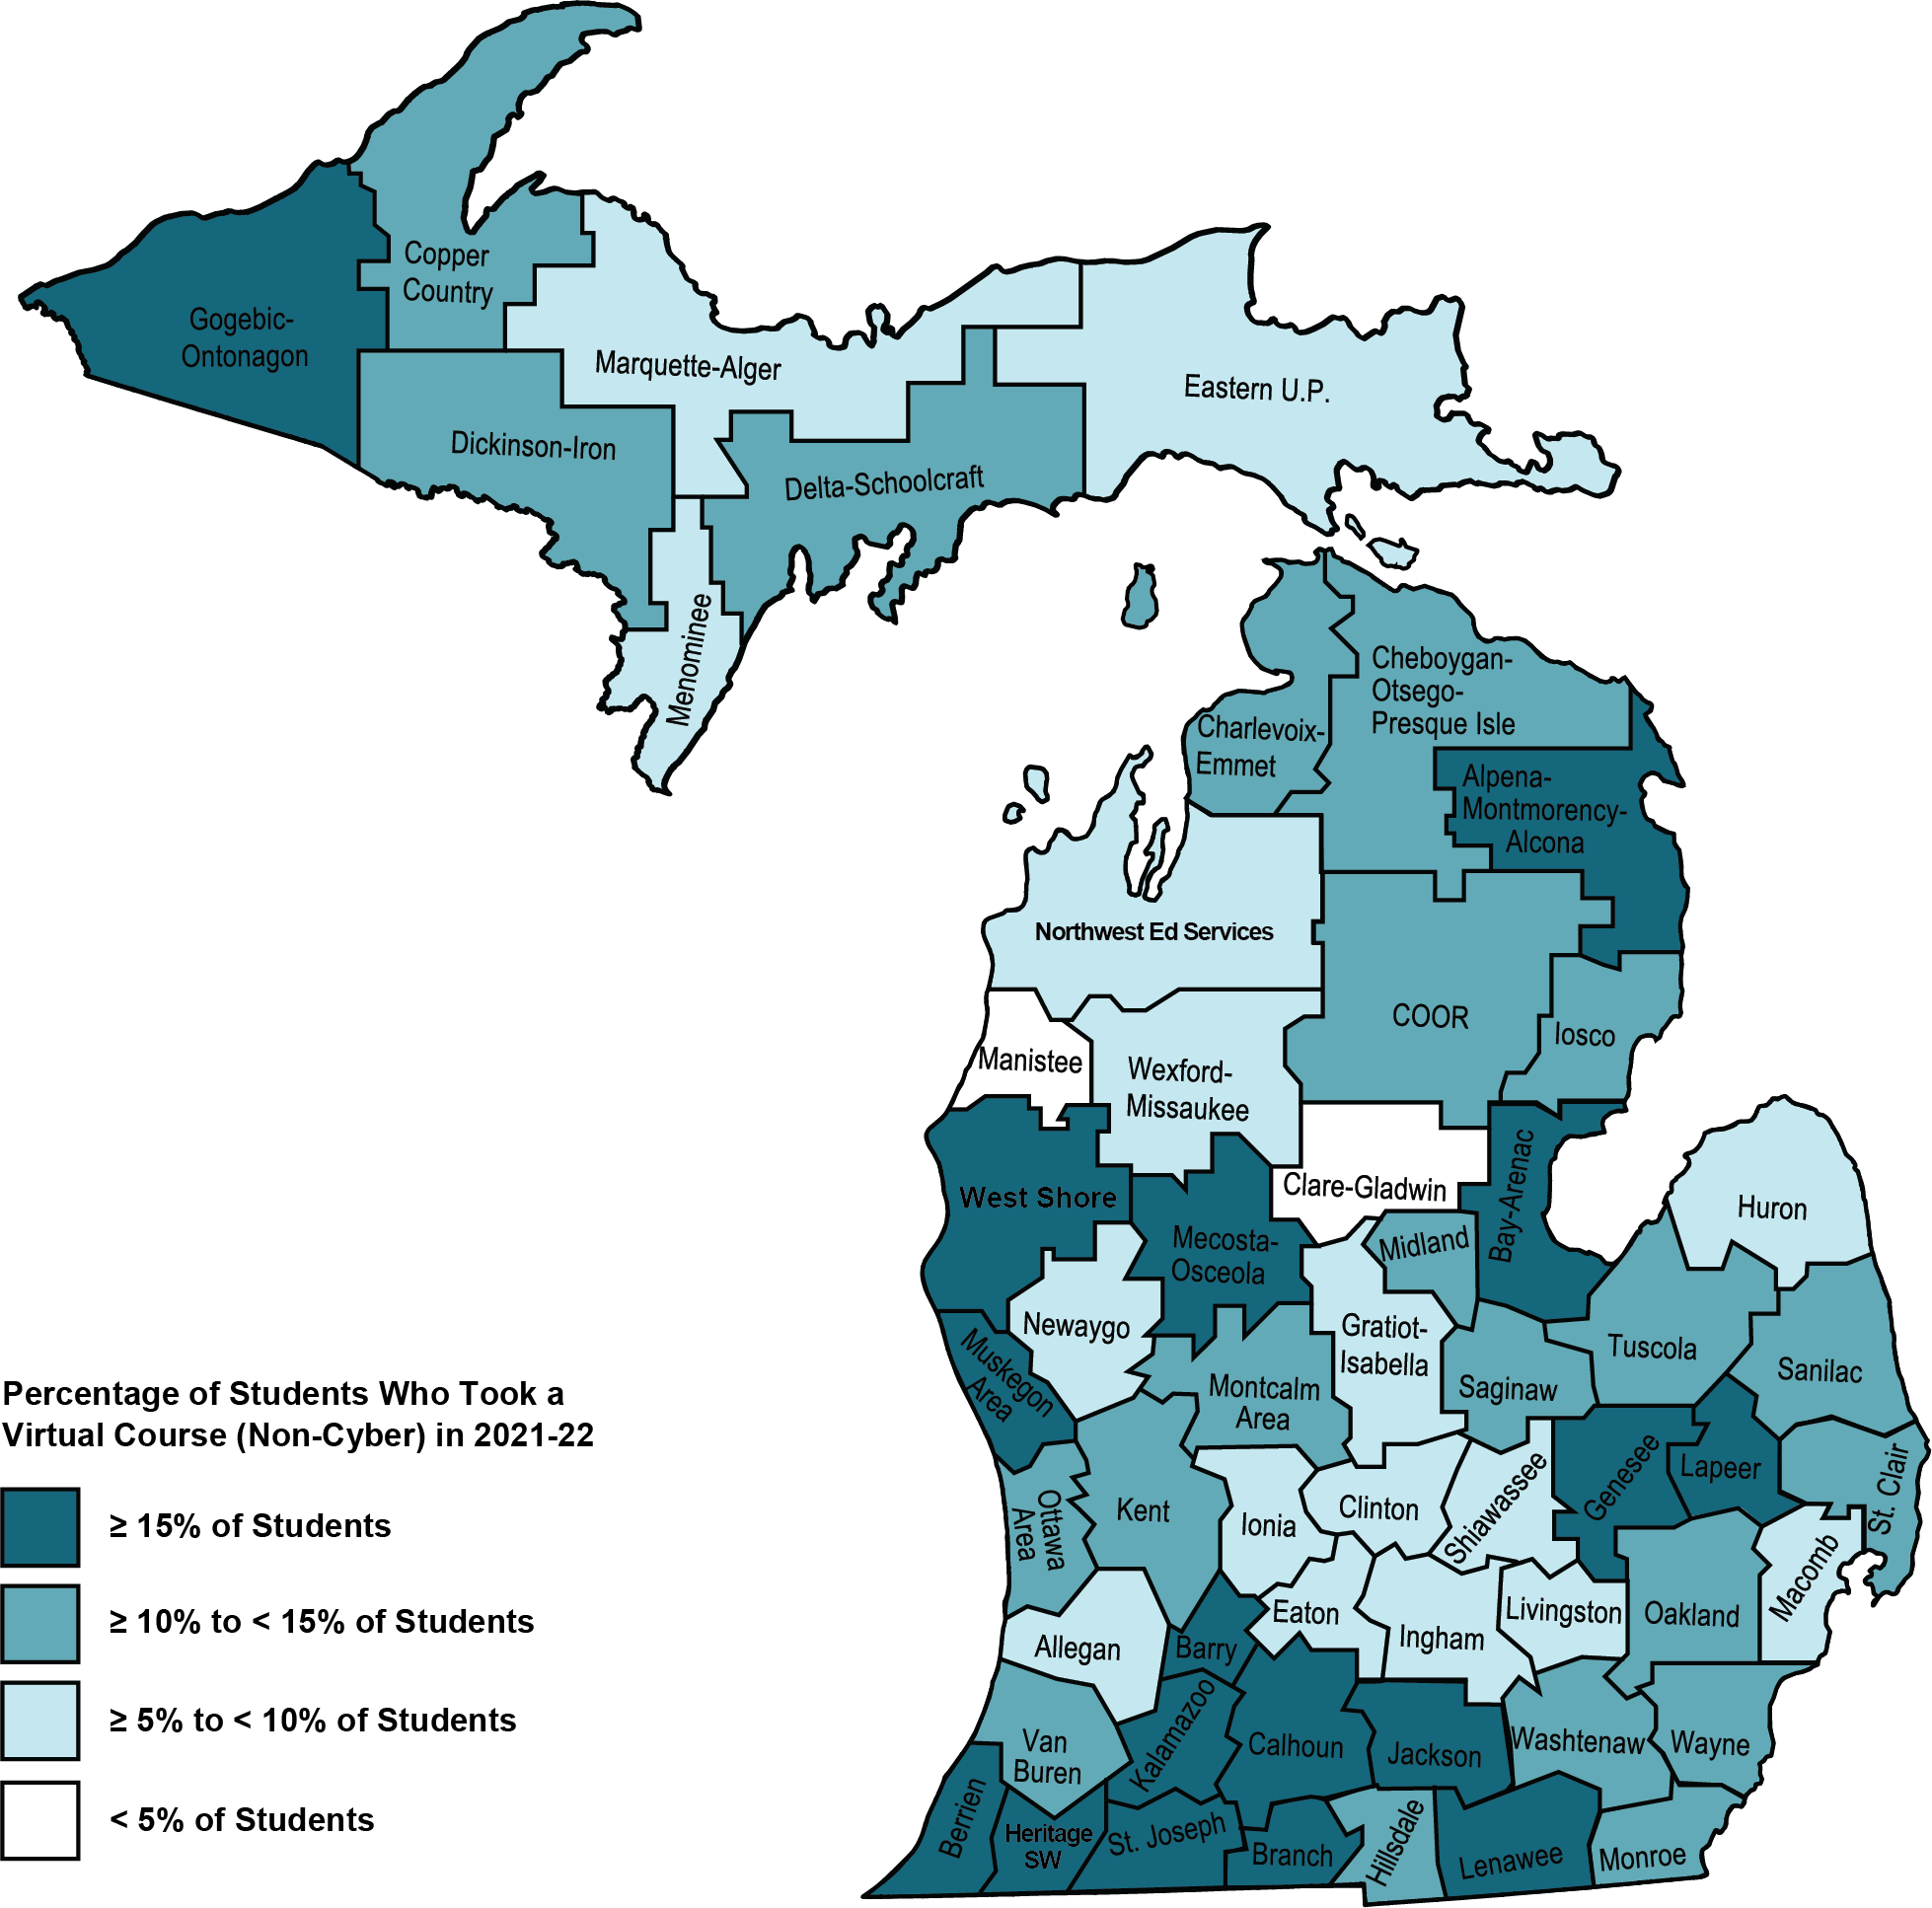
Berrien, Muskegon Area, and Alpena-Montmorency-Alcona ISDs/RESAs had over 25% of students in their service areas take a virtual course in 2021-22. In total, there were 17 ISDs/RESA with 15% or more of the students taking virtual courses. An additional 21 ISDs/RESA had at least 10% and less than 15% of their students take a virtual course. Only two ISDs, Manistee and Clare-Gladwin, had less than 5% of their students take at least one virtual course. See Figure 2.
Figure 2. 2021-22 Percentage of Students Who Took a Virtual Course (Non-Cyber) by ISD
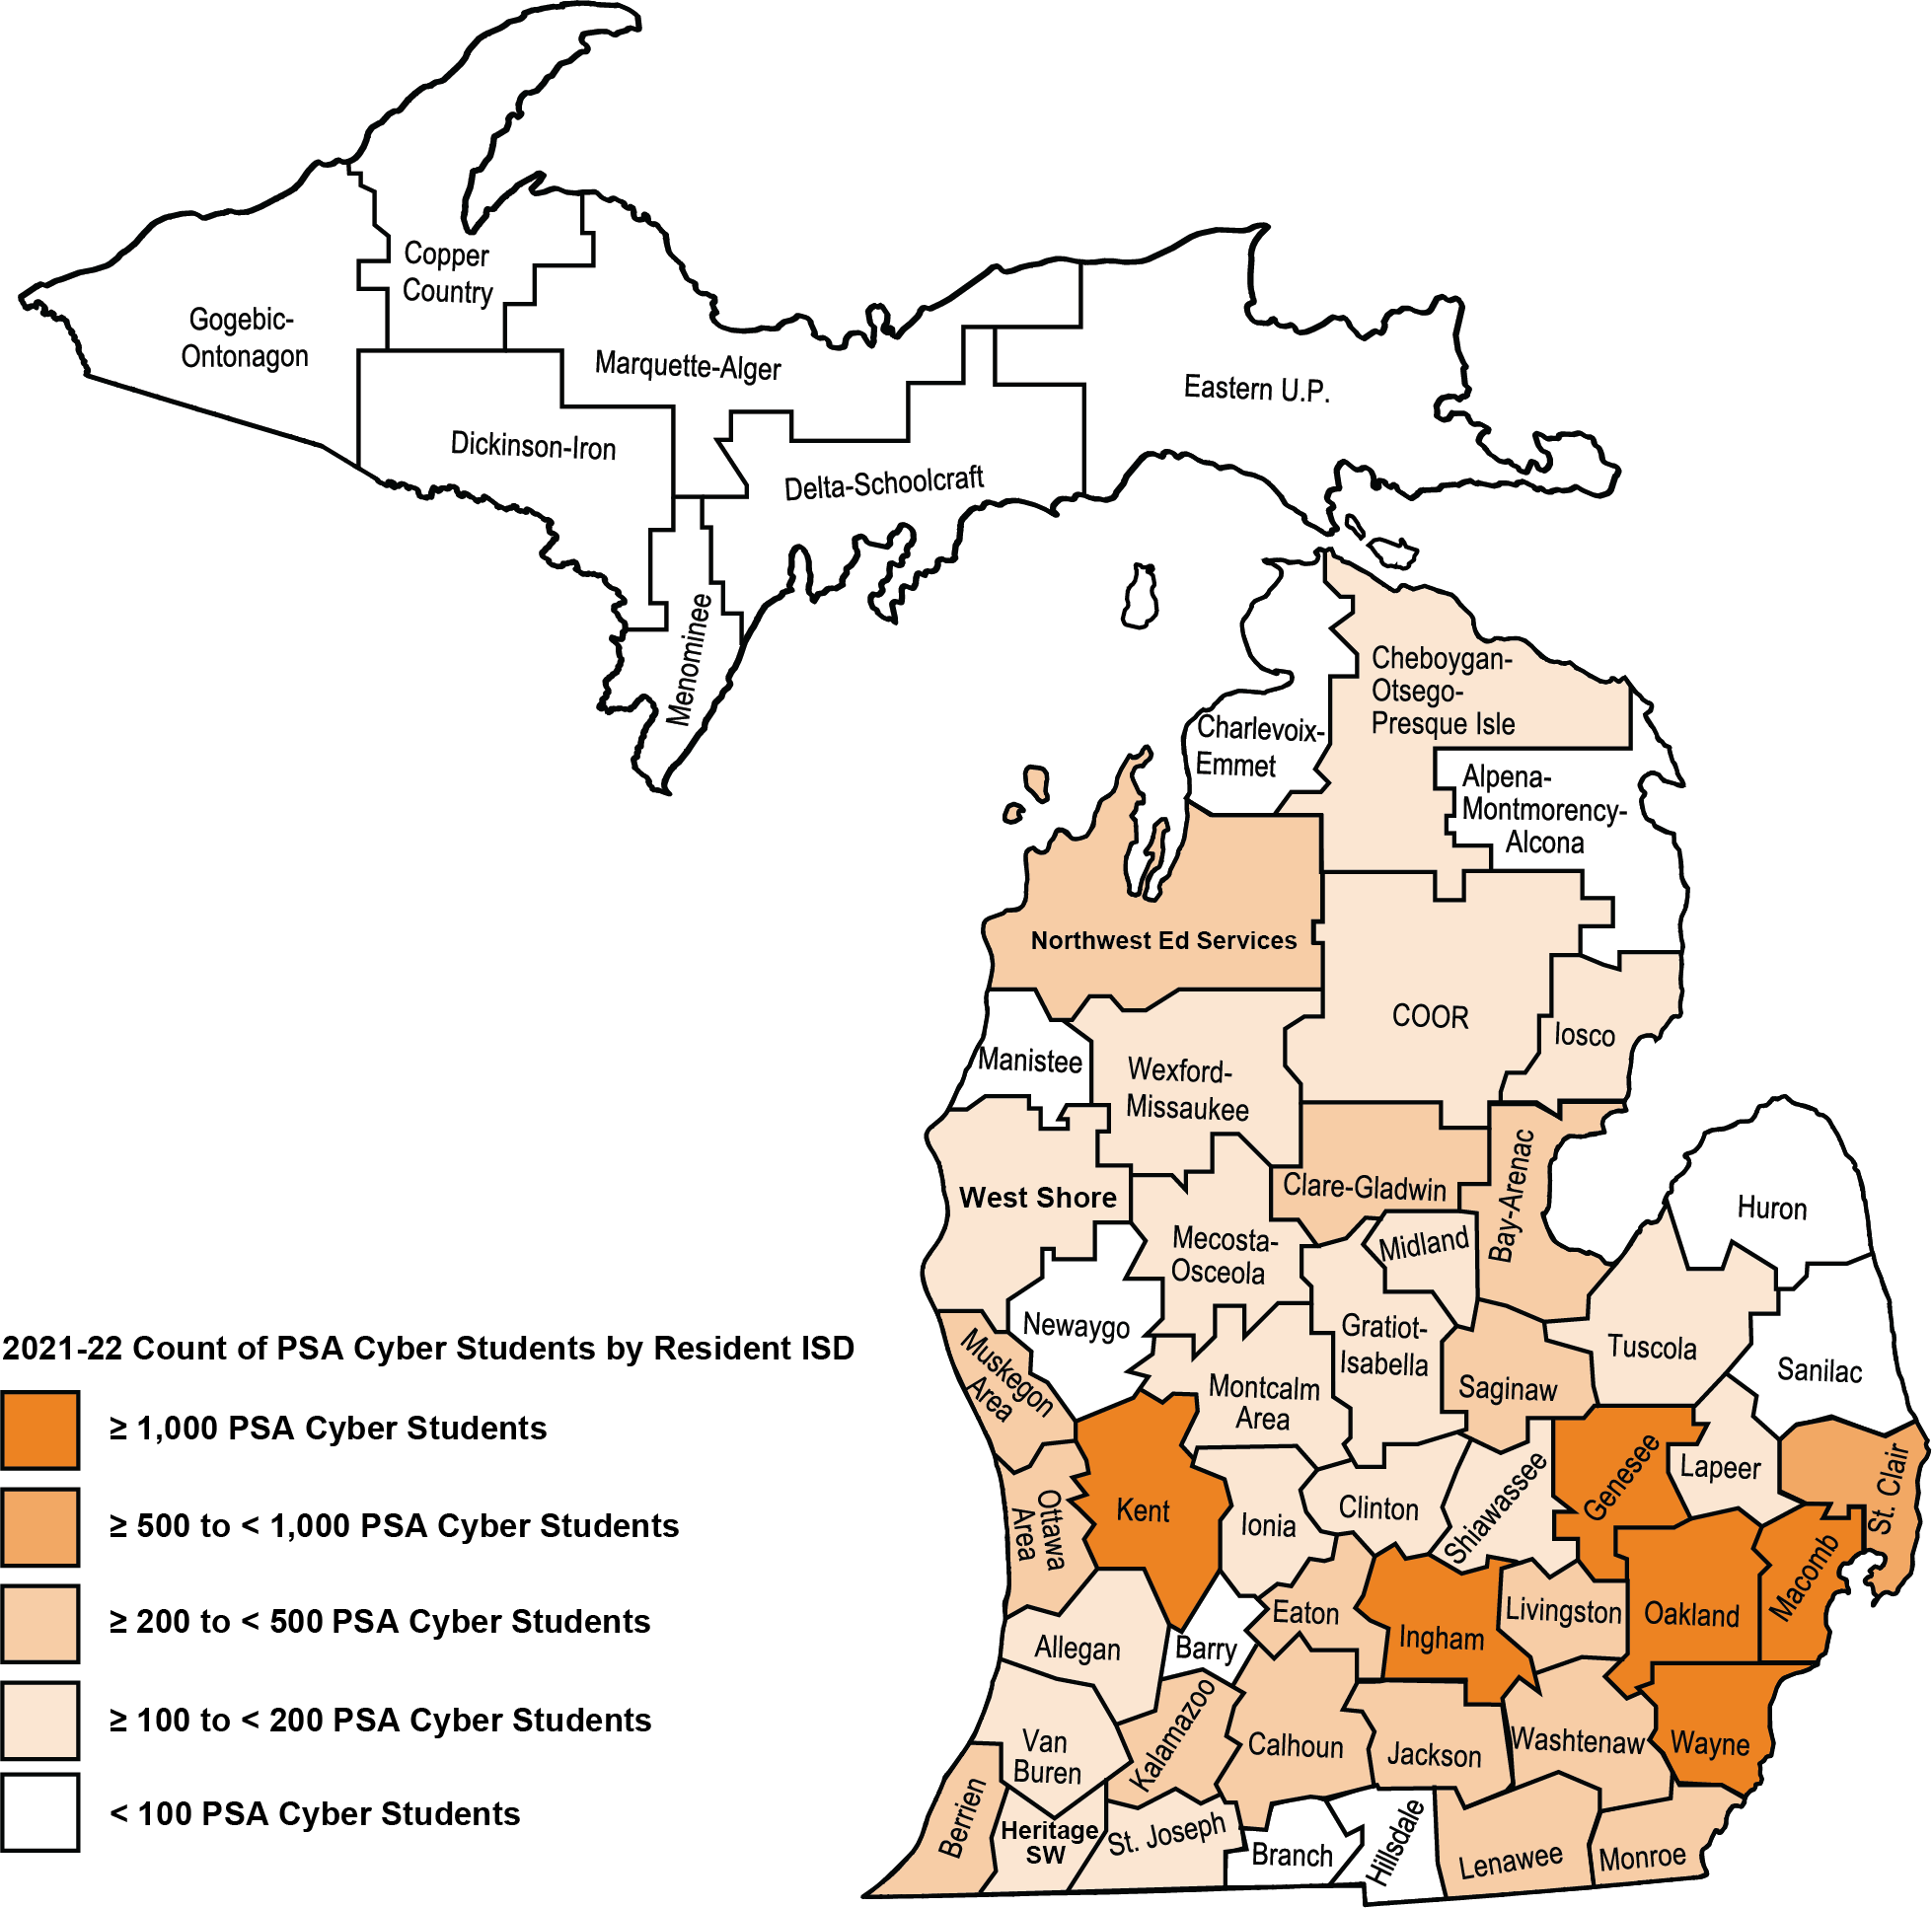
About one in five students (over 5,000 students) attending a PSA cyber school resided within the Wayne RESA service area. The Genesee, Ingham, Kent, Macomb, and Oakland ISD service areas were the only other ISDs with 1,000 or more of their resident students attending PSA cyber schools. Only one ISD, St. Clair, had between 500 and less than 1,000 students. See Figure 3.
Figure 3. 2021-22 Count of PSA Cyber School Students by Resident ISD
Reflections on Higher Performing Schools
As the above sections of the report make clear, virtual learning performance, in general, was quite mixed. The analyses in this section will focus exclusively on those schools that achieved pass rates of 80% or higher to glean a clearer picture of what virtual learning looked like for these schools and programs and how it might have differed, if at all, from the state statistics.
There were 705 Michigan schools with virtual pass rates of 80% or higher, reflecting 37% of all schools in the state with virtual learners. These schools reported 76,894 virtual learners or about 37% of the state's virtual learners. When zooming in on these higher performing schools, the data show:
Successful virtual programs can support various numbers of students, enrollments, and courses offerings – These schools showed success with 10 or fewer students (35%) and 100 or more students (27%). See Table F1. Some offered few enrollments (104 schools had one to nine virtual enrollments) while others offered many (over 342 schools had 100 or more). See Table F2. They also varied in the numbers of course titles offered. Thirty-five percent of these schools offered 10 or fewer virtual courses titles. Twenty percent had enrollments between 26 and 50 courses, and 19% of these schools had students in more than 50 different virtual courses. See Table F3.
LEA and PSA schools can offer successful virtual programs – Thirty-five percent of LEA schools with virtual programs had schoolwide virtual pass rates of 80% or higher. For PSA schools, 48% achieved pass rates of 80% or higher. See Table F4. Both traditional school districts and charter districts can run successful virtual programs; however, PSA schools are seemingly finding greater success.
Schools in cities, suburbs, towns, and rural settings are proving virtual learning success – All locales had schools with virtual pass rates of 80% or higher. Suburban schools had over 40% of their schools reach this threshold whereas City and Town school were 27% and 30%, respectively. See Table F5. These schools are proving virtual learning can succeed across the various geographies of the state, but that it appeared to be a bigger challenge in the City and Town settings.
These schools show strong results across students of different race/ethnicities – These higher performing schools also showed promise for equitable outcomes for students of different races and ethnicities. The pass rates for African American or Black students (96%) and Hispanic or Latino (94%) exceed the White pass rate (92%). Asian students had the highest pass rate at 97%. See Table F6. For these schools, virtual programs appear to be approaching more equitable outcomes.
Students in poverty are succeeding in these virtual programs – Recall that across the entire state, students in poverty had a pass rate (64%) that was 14 percentage points lower than those virtual students who were not in poverty. In these 705 schools, the virtual pass rate for students in poverty rose to 93%---much closer to the 95% virtual pass rate for the students in those schools who were not in poverty. Students in poverty continued to represent a large percentage of virtual learners (56%) and virtual enrollments (61%) in these schools, but smaller than the 63% of virtual learners and 68% of virtual enrollments seen across all virtual programs across the state. See Table F7. Additionally, virtual program success varied by a school’s free or reduced-lunch category (FRL). Fifty percent of Low FRL schools with virtual learners achieved virtual pass rates of 80% or higher. It was 43% of the Mid-Low FRL schools, 34% of Mid-High FRL schools, and 26% of High FRL schools. See Table F8. While some High FRL schools showed it is possible, it was considerably rarer than it was for Low FRL schools.
Both full- and part-time programs can run effective virtual programs, but success is rarer for full-time programs – Thirty-eight percent of part-time programs were able to yield schoolwide virtual pass rates of 80% or higher. It was considerably more difficult for full-time programs to achieve similar success. Only 17 of the 94 full-time programs (18%) reached the 80% pass rate mark. See Table F9.
Both general education and alternative education programs reached 80% school-wide virtual pass rates – There were 658 general education schools in Michigan that achieved schoolwide virtual pass rates of 80% or higher. These 658 schools represented 41% of general education schools with virtual programs. For alternative programs, 36 schools reached this mark. As a percentage of alternative programs, it represented just 13% of such schools, indicating that while possible, this threshold of success remains a sizable challenge. See Table F10.
Virtual students can perform at or above their face-to-face performance level – In these 705 schools, there were 11,950 virtual learners who took a minimum of three virtual courses and had data for a minimum of three non-virtual courses. Eighty-four percent of these students had virtual pass rates that met or exceeded their non-virtual pass rates. See Table F11.
Conclusion
This year’s report represents the 12th year of data on the effectiveness of virtual learning in Michigan’s K-12 system. Many trends witnessed in past years continue to exist. As Table 1 makes clear, the explosive growth witnessed last school year due to the pandemic subsided substantially, but the numbers remained well above pre-pandemic levels.
Table 1. Summary of Virtual Learning Metrics by School Year Since 2010-11
School Year | # of Virtual Learners | # of Virtual Enrollments | # of Schools | Virtual Pass Rate |
|---|---|---|---|---|
2010-11 | 36,348 | 89,921 | 654 | 66% |
2011-12 | 52,219 | 153,583 | 850 | 62% |
2012-13 | 55,271 | 185,053 | 906 | 60% |
2013-14 | 76,122 | 319,630 | 1,007 | 57% |
2014-15 | 91,261 | 445,932 | 1,072 | 60% |
2015-16 | 90,878 | 453,570 | 1,026 | 58% |
2016-17 | 101,359 | 517,470 | 1,102 | 55% |
2017-18 | 112,688 | 581,911 | 1,158 | 55% |
2018-19 | 120,669 | 639,130 | 1,225 | 55% |
2019-20 | 121,900 | 672,682 | 1,225 | 56% |
2020-21 | 418,513 | 3,647,493 | 2,207 | 74% |
2021-22 | 208,460 | 1,408,763 | 1,914 | 69% |
Given the emergency nature of last year's numbers, the ideal scenario for this year probably would have been to see enrollment levels drop but the virtual pass rate remain or increase. From an enrollment perspective, we did see a huge year over year decline of more than 2M enrollments. Unfortunately, we also saw a five-percentage point drop in the virtual pass rate.
As we predicted in last year's report, the virtual pass rate drop is related to a few key data points making substantial shifts back toward pre-pandemic levels. One of these factors was the impact of single year virtual learning programs last year. This year, close to 600 schools that were new virtual learning programs last year did not report any virtual learners. Those "new" schools had close to 650K virtual enrollments and a 77% virtual pass rate last year. A second shift related to Alternative Education programs. Prior to the pandemic, Alternative Education programs produced close to half the virtual enrollments. Last year, they dropped to just 10%, but this year rose back up to be 28% of the virtual enrollments. This is particularly important because the pass rate gap between Alternative Education programs and General Education programs is sizable. For this year, that performance gap was 26 percentage points lower for Alternative Education programs. A third factor was grade level. Pre-pandemic, we saw about 80% of the virtual enrollments come from the high school level, that percentage dropped to 40% for the 2020-21 school year. This year, the high school percentage was up to 56% of virtual enrollments. With elementary and middle school pass rates in the 80s and 70s, respectively, and high school grades tending to be more in the 50s and 60s, the shift back toward a larger percentage of high school enrollments predictably is accompanied by a lower overall pass rate. If these figures continue shifting back toward pre-pandemic levels, we are likely to see the overall pass rate continue to backslide.
On the positive side, the report also captured examples of schools and students benefiting from virtual learning. Thirty-seven percent of virtual learners were attending schools that had virtual pass rates of 80% or higher, and equity of outcomes was much closer to desired reality. Clearly, these schools add to the evidence that online learning can and does work for many schools and students. To date, however, these schools reflect more of the exception---the hope---rather than the rule. As school, community, and legislative leaders evaluate their virtual learning programs, the data provided in this report can serve as informative benchmarks, and the varied analyses can be used as models to understand local implementation success at a deeper level.
School leaders looking to take the next step forward with their virtual programs may find value in the many free resources that Michigan Virtual has authored. These resources include a series of practical guides to online learning designed for students, parents, teachers, mentors, school administrators, and school board members. Michigan Virtual also provides quality reviews of supplemental online learning programs to Michigan schools at no cost. There are also the National Standards for Quality Online Learning, which offer frameworks to evaluate online programs, online teaching, and online courses. Finally, educational leaders looking to communicate and collaborate with others around the future of learning may find value in the Future of Learning Council.
Appendix A - Methodology
COVID-19 Impact
Readers should note that the COVID-19 pandemic continued to impact schools throughout the 2021-22 school year. Some school districts. Thus, caution is advised when comparing this year's findings with prior years.
About the Data
The data for this report came from the following sources:
Michigan Student Data System – School Year 2021-2022;
Educational Entity Master (EEM);
Michigan Student Data System Teacher Student Data Link (TSDL) – Collection Year 2021-2022; and
Michigan’s K-12 Virtual Learning Effectiveness Report, 2020-21 – Used for comparing this year’s data with the 2020-21 school year.
Because the data for this report incorporates this variety of sources, the findings within may differ from those found through the MI School Data portal which may use different query parameters.
Enrollments classified as virtual in this report were treated as such due to the TSDL virtual method field indicating virtual delivery. Enrollments where the TSDL virtual method field was set to “Blended Learning,” “Digital Learning,” or “Online Course” were treated as virtual. According to the Michigan Student Data Collection Manual Version 3.0, the virtual method field indicates "the type of virtual instruction the student is receiving.” (See page 354).
In prior years of the report, additional strategies, such as keyword searches of the local course title field, were used to flag virtual enrollments. Past years demonstrate that such efforts yield a low percentage of the virtual enrollments, and therefore were discontinued with the prior school year.
Michigan Virtual Students
Because this report is published by Michigan Virtual, some people have falsely concluded that the data in this report is about Michigan Virtual students only. Quite the contrary, the data in this report represent K-12 virtual learning across all providers, and Michigan Virtual as a provider would reflect only a small percentage of the virtual enrollments covered in this report. Readers interested in Michigan Virtual specific results can find those published in its Annual Report: 21-22, which include data on the number of students, districts, and enrollments served as well as its virtual pass rate.
Enrollment Calculations
Enrollment data for this report principally relies on data collected in the MSDS Student Course Component. See page 332 of the Michigan Student Data System Collection Details Manual Version 3.0 for more details about this collection. Through this collection, the State collects data for each course a student takes. It is important to note some key variations in the data collection that impact possible approaches to calculating enrollment counts.
An example of known variation is the local naming conventions for course titles. For instance, one school may call a course “English 9”, another “9th Grade English,” and yet another “ELA 9.” The Student Course Component resolves this issue by requiring schools to report each enrollment with a Subject Area Code and a Course Identifier Code (SCED Course Code). These codes are created by the National Center for Education Statistics through the School Courses for the Exchange of Data (SCED) initiative. By using these standardized codes, we can compare data more readily across schools.
Another important variation involves course sections. In addition to the course title and SCED Course Code, schools frequently parse a course title into multiple sections. For example, a school with trimester courses may break a course into three sections, one for each trimester. A semester-based school, on the other hand, may break up a course into two sections. Others have chosen to break their courses into even smaller units such as quarters while others report what seem to be course units or lessons. Sometimes, schools use course sections to differentiate the online and face-to-face components of courses. For our purposes, the key point is that there is not always one enrollment record per student per course title.
Multiple course sections for a single course title are not, in and of themselves, problematic. They could be resolved if a weighting variable---for instance, the fraction of a Carnegie unit each section represents---was collected. The State does collect a field, Credits Granted, in the Student Course Component that might be used. However, two main drawbacks significantly impair its use. The first is that the field is only required for Migrant-eligible and dual-enrolled students. As such, many enrollments do not have a reported value. The second hindrance is inconsistent reporting of data that do exist. In some cases, schools report the Carnegie unit that was possible to be earned (same value no matter the completion status of the enrollment), although others treat the field value as variable depending on how well the student did (e.g., report a 0.5 for a student with a “Completed/Passed” completion status, but a 0.0 for a student who had a “Completed/Failed” completion status). These drawbacks make the Credits Granted field unusable as a weighting variable.
The challenge of variable course sections reported is multiplied when more than one school entity reports on the same pupil. The data appear to contain instances of two or more schools reporting on the same enrollments. Flavors of this appear to be a school partnering with an ISD to provide special education services and both reporting the same enrollments. Another example appears to occur when a student transfers from one district and then enrolls in the same courses at the new school. Table A1 and Table A2 highlight enrollment variation.
Table A1. 2021-22 Virtual Enrollment Counts and Pass Rates by Number of Virtual Enrollments Per Student/SCED Code Pair
# of Virtual Enrolls per Student/SCED Code Pair | # of Enrolls | % of Enrolls | Pass Rate |
|---|---|---|---|
1 | 714,522 | 51% | 73% |
2 | 509,688 | 36% | 65% |
3 | 87,939 | 6% | 56% |
4 | 62,672 | 4% | 67% |
5 | 9,365 | 1% | 50% |
6 or More | 24,577 | 2% | 67% |
Total | 1,408,763 | 100% | 69% |
Table A2. 2021-22 Percentage of Students by Total Student Enrollment Counts (Virtual and Non-Virtual) and Full- or Part-Time Schools
Enrollment Count (Virtual and Non-Virtual) | Full-Time | Part-Time |
|---|---|---|
1 to 5 | 7% | 6% |
6 to 10 | 30% | 29% |
11 to 15 | 47% | 40% |
16 to 20 | 12% | 17% |
21+ | 5% | 8% |
Total | 100% | 100% |
Given these data limitations, enrollment counts and related data figures in this report should be treated as estimates that, generally speaking, convey the trends observed for the school year.
Pass Rate Calculations
For this report, the pass rate was calculated based on data reported in the “Completion Status” field. For more information about the Completion Status field, including definitions for each status, see page 349 of the Michigan Student Data System Collection Details Manual Version 3.0. Column one of Table A3 displays the various statuses reported by schools for the virtual enrollments.
Table A3. 2021-22 Number and Percentage of Virtual Enrollments by Completion Status
Completion Status | # of Enrolls | % of Enrolls |
|---|---|---|
Audited (No Credit Issued) | 1,460 | 0% |
Completed/Failed | 184,647 | 13% |
Completed/Passed | 965,076 | 69% |
Incomplete | 87,802 | 6% |
Ongoing Enrolled | 43 | 0% |
Testing Out | 303 | 0% |
Withdrawn/Exited | 111,442 | 8% |
Withdrawn/Failing | 14,994 | 1% |
Withdrawn/Passing | 42,996 | 3% |
Total | 1,408,763 | 100% |
Throughout this report, the pass rate simply represents the percentage of virtual enrollments with a status of “Completed/Passed.” Notice that the percentage of enrollments with a “Completed/Passed” status in Table A3 matches the statewide pass rate. This pass rate formula remains consistent with past reports.
Please keep in mind that calculating the pass rate in this manner will result in the lowest possible percentage. To illustrate why this is, consider the completion status of “Audited (No Credit Issued).” These virtual enrollments are not “failures” per se, but act as such in the formula since they are added to the formula's denominator without impacting the numerator. Another example is enrollments with a completion status of “Incomplete.” About 6% of the virtual enrollments in this report were classified as “Incomplete.” As such, they are treated in the report’s pass rate formula as zero passes, even though some may eventually be awarded a passing status. Finally, it is unclear how to best treat enrollments with a “Withdrawn” status. For instance, 3% of the virtual enrollments in 2021-22 were marked as “Withdrawn/Passing,” meaning that the student was passing the course at the time the student was withdrawn. Should these enrollments be counted as failures? What about students whose enrollments were marked as “Withdrawn/Exited” (8% of the virtual enrollments)? Based on the data available, there is no way to determine whether that exiting occurred in the first few weeks of class or the final weeks of class. The data do not provide insight into whether the student was re-enrolled in a different course or whether it was too late for re-enrollment in a credit-bearing opportunity for the student.
The research team raises these issues because they represent questions for which there are no definitive answers. In the end, the team decided to report the pass rate as the percentage of all virtual enrollments that were reported as “Completed/Passed.” To provide readers with a better idea of the impact of this approach, additional data tables are provided in Appendix G to allow interested readers in drawing their own conclusions and calculating their own formulas for many of the pass rates reported.
Appendix B - School Tables
Note: Clicking on the hyperlinked table number will return to the section of the report that discusses the table.
Table B1. Two Year Comparison (2020-21 and 2021-22) of Virtual Enrollment Data
School Years | # of Schools | % of 2021-22 Schools | # of 2021-22 Enrolls | % of 2021-22 Enrolls | 2021-22 Pass Rate |
|---|---|---|---|---|---|
2020-21 Only | 594 | NA | NA | NA | NA |
2021-22 Only | 301 | 16% | 97,043 | 7% | 65% |
Both Years (2020-21 and 2021-22) | 1,613 | 84% | 1,311,720 | 93% | 69% |
Note: The # schools in the "2020-21 Only" row had 643,497 enrollments and a 77% pass rate for that year. The 1,613 schools in both years had a pass rate of 73% for 2020-21.
Table B2. Virtual Enrollment Differences for Schools Reporting Virtual Learners in Both 2020-21 and 2021-22
Year-to-Year Enroll Difference | # of Schools | % of Schools | # of Enrolls | % of Enrolls |
|---|---|---|---|---|
+1,000 or More | 39 | 2% | 280,858 | 21% |
+500 to +999 | 54 | 3% | 104,293 | 8% |
+100 to +499 | 150 | 9% | 128,670 | 10% |
0 to +99 | 193 | 12% | 53,358 | 4% |
-1 to -99 | 215 | 13% | 39,016 | 3% |
-100 to -499 | 274 | 17% | 118,674 | 9% |
-500 to -999 | 237 | 15% | 144,390 | 11% |
-1,000 or More | 451 | 28% | 442,461 | 34% |
Total | 1,613 | 100% | 1,311,720 | 100% |
Table B3. Virtual Pass Rate Differences for Schools Reporting Virtual Learners in Both 2020-21 and 2021-22
Year-to-Year Pass Rate Difference | # of Schools | % of Schools | # of Enrolls | % of Enrolls |
|---|---|---|---|---|
50 or More Percentage Points Increase | 44 | 3% | 15,202 | 1% |
25 to 49 Percentage Points Increase | 125 | 8% | 59,703 | 5% |
10 to 24 Percentage Points Increase | 286 | 18% | 180,166 | 14% |
0 to 9 Percentage Points Increase | 376 | 23% | 519,305 | 40% |
1 to 9 Percentage Points Decrease | 242 | 15% | 317,684 | 24% |
10 to 24 Percentage Points Decrease | 180 | 11% | 142,775 | 11% |
25 to 49 Percentage Points Decrease | 102 | 6% | 60,692 | 5% |
50 or More Percentage Points Decrease | 78 | 5% | 9,674 | 1% |
NA - < 10 Enrolls in One or Both Years | 180 | 11% | 6,519 | 0% |
Total | 1,613 | 100% | 1,311,720 | 100% |
Table B4. 2021-22 Count and Pass Rate of K-12 Virtual Enrollments by Grade Level
Grade Level | # of Enrolls | % of Enrolls | % Change | Pass Rate | % Change from 20-21 |
|---|---|---|---|---|---|
K | 55,921 | 4% | -75% | 86% | 3% |
1 | 57,164 | 4% | -74% | 87% | 5% |
2 | 58,048 | 4% | -75% | 88% | 5% |
3 | 60,720 | 4% | -73% | 85% | 2% |
4 | 58,219 | 4% | -75% | 85% | 2% |
5 | 62,411 | 4% | -74% | 83% | 0% |
6 | 83,285 | 6% | -68% | 79% | 0% |
7 | 87,144 | 6% | -68% | 75% | 0% |
8 | 92,499 | 7% | -68% | 73% | -1% |
9 | 154,708 | 11% | -55% | 49% | -10% |
10 | 178,060 | 13% | -51% | 56% | -6% |
11 | 190,129 | 13% | -45% | 59% | -5% |
12 | 270,455 | 19% | -30% | 65% | -2% |
Total | 1,408,763 | 100% | -61% | 69% | -5% |
Table B5. 2021-22 Pass Rate Comparison for Virtual Learners in Their Virtual and Non-Virtual Courses
Grade Level | Virtual Pass Rate | Non-Virtual Pass Rate |
|---|---|---|
K | 86% | 73% |
1 | 87% | 79% |
2 | 88% | 69% |
3 | 85% | 70% |
4 | 85% | 69% |
5 | 83% | 74% |
6 | 79% | 62% |
7 | 75% | 60% |
8 | 73% | 64% |
9 | 49% | 60% |
10 | 56% | 67% |
11 | 59% | 73% |
12 | 65% | 80% |
Total | 69% | 71% |
Table B6. 2021-22 Number and Percentage of Schools and Virtual Enrollments by School Pass Rate
School Pass Rate | # of Schools | % of Schools | # of Enrolls | % of Enrolls |
|---|---|---|---|---|
0% to <10% | 130 | 7% | 17,136 | 1% |
10% to <20% | 49 | 3% | 13,110 | 1% |
20% to <30% | 77 | 4% | 79,235 | 6% |
30% to <40% | 102 | 5% | 84,137 | 6% |
40% to <50% | 128 | 7% | 117,033 | 8% |
50% to <60% | 171 | 9% | 154,149 | 11% |
60% to <70% | 250 | 13% | 257,712 | 18% |
70% to <80% | 287 | 15% | 161,973 | 11% |
80% to <90% | 277 | 14% | 172,513 | 12% |
90% to 100% | 443 | 23% | 351,765 | 25% |
Total | 1,914 | 100% | 1,408,763 | 100% |
Table B7. 2021-22 Number and Percentage of Schools and Virtual Enrollments by Entity Type
Entity Type | # of Schools | % of Schools | # of Enrolls | % of Enrolls |
|---|---|---|---|---|
ISD School | 29 | 2% | 9,729 | 1% |
ISD Unique Education Provider | 5 | 0% | 853 | 0% |
LEA School | 1,685 | 88% | 828,127 | 59% |
LEA Unique Education Provider | 10 | 1% | 5,772 | 0% |
PSA School | 184 | 10% | 564,278 | 40% |
State School | 1 | 0% | 4 | 0% |
Total | 1,914 | 100% | 1,408,763 | 100% |
Table B8. 2021-22 Virtual Pass Rate by Entity Type
Entity Type | Pass Count | # of Enrolls | Pass Rate |
|---|---|---|---|
ISD School | 6,507 | 9,729 | 67% |
ISD Unique Education Provider | NR | NR | NR |
LEA School | 534,488 | 828,127 | 65% |
LEA Unique Education Provider | 4,523 | 5,772 | 78% |
PSA School | 418,850 | 564,278 | 74% |
State School | NR | NR | NR |
Total | 965,076 | 1,408,763 | 69% |
Table B9. 2021-22 Number and Percentage of Full-Time (FT) Virtual or Cyber School
Entity Type | # of FT Schools | % of FT Schools |
|---|---|---|
ISD School | 1 | 1% |
LEA School | 75 | 80% |
LEA Unique Education Provider | 1 | 1% |
PSA School | 17 | 18% |
Total | 94 | 100% |
Table B10. 2021-22 Number and Percentage of Students and Enrollments from Full-Time (FT) Virtual or Cyber Schools with Pass Rates
Entity Type | # of FT Students | % of FT Students | # of FT Enrolls | % of FT Enrolls | Pass Rate |
|---|---|---|---|---|---|
ISD School | NR | NR | NR | NR | NR |
LEA School | 24,544 | 47% | 217,340 | 43% | 57% |
LEA Unique Education Provider | NR | NR | NR | NR | NR |
PSA School | 27,149 | 52% | 279,647 | 56% | 61% |
Total | 52,198 | 100% | 502,284 | 100% | 59% |
Note: Data are not reported (NR) if there were fewer than 10 schools for that cell or to prevent calculating cell values.
Table B11. 2021-22 Number and Percentage of Part-Time (PT) Virtual Schools
Entity Type | # of PT Schools | % of PT Schools |
|---|---|---|
ISD School | 28 | 2% |
ISD Unique Education Provider | 5 | 0% |
LEA School | 1,610 | 88% |
LEA Unique Education Provider | 9 | 0% |
PSA School | 167 | 9% |
State School | 1 | 0 |
Total | 1,820 | 100% |
Table B12. 2021-22 Number and Percentage of Students and Enrollments from Part-Time (PT) Virtual Schools with Pass Rates
Entity Type | # of PT Students | % of PT Students | # of PT Enrolls | % of PT Enrolls | Pass Rate |
|---|---|---|---|---|---|
ISD School | 1,232 | 1% | 5,110 | 1% | 78% |
ISD Unique Education Provider | NR | NR | NR | NR | NR |
LEA School | 121,412 | 77% | 610,787 | 67% | 67% |
LEA Unique Education Provider | NR | NR | NR | NR | NR |
PSA School | 35,608 | 22% | 284,631 | 31% | 87% |
State School | NR | NR | NR | NR | NR |
Total | 158,549 | 100% | 906,479 | 100% | 74% |
Note: Because some students took courses across multiple entity types, a student may be counted toward more than one type. The total row, however, reflects the number of unique students.
Table B13. 2021-22 Number and Percentage of Schools and Virtual Enrollments by School Emphasis
School Emphasis | # of Schools | % of Schools | # of Enrolls | % of Enrolls |
|---|---|---|---|---|
Alternative Education | 277 | 14% | 393,218 | 28% |
General Education | 1,606 | 84% | 1,011,896 | 72% |
Special Education | 27 | 1% | 3,437 | 0% |
Vocational/CTE | 4 | 0% | 212 | 0% |
Total | 1,914 | 100% | 1,408,763 | 100% |
Table B14. 2021-22 Virtual Pass Rate by School Emphasis
School Emphasis | Pass Count | # of Enrolls | Pass Rate |
|---|---|---|---|
Alternative Education | 194,803 | 393,218 | 50% |
General Education | 768,064 | 1,011,896 | 76% |
Special Education | NR | NR | NR |
Vocational/CTE | NR | NR | NR |
Total | 965,076 | 1,408,763 | 69% |
Note: Data are not reported (NR) if there were fewer than 10 schools for that cell or to prevent calculating cell values.
Table B15. 2021-22 Virtual Pass Rates for General Education and Alternative Education Schools by Entity Type
Entity Type | General Ed Pass Rate | Alternative Ed Pass Rate |
|---|---|---|
ISD School | NR | NR |
ISD Unique Education Provider | NR | NR |
LEA School | 72% | 51% |
LEA Unique Education Provider | NR | NR |
PSA School | 80% | 43% |
State School | NR | NR |
Total | 76% | 50% |
Note: Data are not reported (NR) if there were fewer than 10 schools for that cell or to prevent calculating cell values.
Table B16. 2021-22 Number and Percentage of Schools and Virtual Enrollments by Number of Virtual Enrollments per School
# of Virtual Enrolls Per School | # of Schools | % of Schools | # of Enrolls | % of Enrolls |
|---|---|---|---|---|
1 to 9 | 192 | 10% | 894 | 0% |
10 to 19 | 165 | 9% | 2,260 | 0% |
20 to 29 | 85 | 4% | 2,072 | 0% |
30 to 39 | 89 | 5% | 3,067 | 0% |
40 to 49 | 61 | 3% | 2,726 | 0% |
50 to 59 | 62 | 3% | 3,356 | 0% |
60 to 69 | 41 | 2% | 2,640 | 0% |
70 to 79 | 52 | 3% | 3,865 | 0% |
80 to 89 | 37 | 2% | 3,110 | 0% |
90 to 99 | 47 | 2% | 4,438 | 0% |
100+ | 1,083 | 57% | 1,380,335 | 98% |
Total | 1,914 | 100% | 1,408,763 | 100% |
Table B17. 2021-22 Percentage of Schools by Ratio of Virtual Courses to Student and School Pass Rate
School Pass Rate | 1 to 2 Virtual Courses / Learner | 3 to 4 Virtual Courses / Learner | 5+ Virtual Courses / Learner |
|---|---|---|---|
0% to <10% | 6% | 5% | 8% |
10% to <20% | 1% | 0% | 4% |
20% to <30% | 1% | 2% | 6% |
30% to <40% | 2% | 3% | 7% |
40% to <50% | 4% | 5% | 8% |
50% to <60% | 7% | 9% | 9% |
60% to <70% | 10% | 14% | 13% |
70% to <80% | 14% | 23% | 13% |
80% to <90% | 21% | 18% | 11% |
90% to 100% | 35% | 20% | 21% |
Total | 100% | 100% | 100% |
Table B18. 2021-22 Number and Percentage of Schools and Virtual Enrollments by Locale
Locale | # of Schools | % of Schools | # of Enrolls | % of Enrolls |
|---|---|---|---|---|
Rural | 589 | 31% | 360,740 | 26% |
Town | 251 | 13% | 128,589 | 9% |
Suburb | 695 | 36% | 579,835 | 41% |
City | 369 | 19% | 299,997 | 21% |
Not Specified | 10 | 1% | 39,602 | 3% |
Total | 1,914 | 100% | 1,408,763 | 100% |
Table B19. 2021-22 Percentage of Schools with Virtual Enrollments by Virtual Enrollment Totals and Locale
Locale | 1 to 24 Enrolls | 25 to 49 Enrolls | 50 to 74 Enrolls | 75 to 99 Enrolls | 100+ Enrolls | Total |
|---|---|---|---|---|---|---|
Rural | 20% | 12% | 7% | 7% | 54% | 100% |
Town | 20% | 10% | 7% | 6% | 57% | 100% |
Suburb | 20% | 7% | 7% | 6% | 61% | 100% |
City | 28% | 12% | 6% | 3% | 51% | 100% |
Not Specified | 0% | 0% | 10% | 0% | 90% | 100% |
Table B20. 2021-22 Virtual Pass Rate by Locale
Locale | Pass Rate | % Change from 20-21 |
|---|---|---|
Rural | 67% | -2% |
Town | 61% | -3% |
Suburb | 70% | -8% |
City | 71% | -4% |
Not Specified | 57% | -11% |
Total | 69% | -5% |
Table B21. 2021-22 Percentage of Schools with Virtual Enrollments by Building Pass Rate and Locale
Locale | 0% to 20% Pass Rate | 20% to 40% Pass Rate | 40% to 60% Pass Rate | 60% to 80% Pass Rate | 80% to 100% Pass Rate | Total |
|---|---|---|---|---|---|---|
Rural | 6% | 9% | 17% | 30% | 38% | 100% |
Town | 8% | 11% | 17% | 33% | 30% | 100% |
Suburb | 5% | 7% | 15% | 29% | 44% | 100% |
City | 24% | 12% | 17% | 21% | 27% | 100% |
Not Specified | 20% | 0% | 30% | 20% | 30% | 100% |
Table B22. 2021-22 Number and Percentage of Schools with Virtual Enrollments by School Free or Reduced-Price Lunch Categories
Free or Reduced-Price Lunch Category | # of Schools with Virtual Learners | # of MI Schools (All) | % of Schools with Virtual Learners |
|---|---|---|---|
Low FRL (<=25%) | 232 | 425 | 55% |
Mid-Low FRL (>25% to <=50%) | 552 | 929 | 59% |
Mid-High FRL (>50% to <=75%) | 614 | 1,070 | 57% |
High FRL (>75%) | 486 | 916 | 53% |
Missing | 30 | NA | NA |
Total | 1,914 | 3,436 | 56% |
Note: All Michigan K-12 schools with building codes were used to calculate the state figures. State data are available through MI School Data.
Table B23. 2021-22 Number and Pass Rate of Virtual Enrollments by School Free or Reduced-Price Lunch Categories
Free or Reduced-Price Lunch Category | Pass Count | # of Enrolls | % of Enrolls | Pass Rate |
|---|---|---|---|---|
Low FRL (<=25%) | 82,212 | 98,059 | 7% | 84% |
Mid-Low FRL (>25% to <=50%) | 221,256 | 278,051 | 20% | 80% |
Mid-High FRL (>50% to <=75%) | 272,798 | 423,031 | 30% | 64% |
High FRL (>75%) | 385,444 | 604,359 | 43% | 64% |
Missing | 3,366 | 5,263 | 0% | 64% |
Total | 965,076 | 1,408,763 | 100% | 69% |
Appendix C - Course Tables
Note: Clicking on the hyperlinked table number will return to the section of the report that discusses the table.
Table C1. 2021-22 Number and Percentage of Virtual Enrollments with Pass Rate by Subject Area
Subject Area | # of Enrolls | % of Enrolls | Pass Rate |
|---|---|---|---|
Agriculture, Food, and Natural Resources | 973 | 0% | 76% |
Architecture and Construction | 393 | 0% | 79% |
Business and Marketing | 14,470 | 1% | 70% |
Communication and Audio/Visual Technology | 6,122 | 0% | 60% |
Computer and Information Sciences | 31,073 | 2% | 75% |
Engineering and Technology | 2,785 | 0% | 83% |
English Language and Literature | 253,201 | 18% | 65% |
Fine and Performing Arts | 128,968 | 9% | 79% |
Foreign Language and Literature | 57,821 | 4% | 59% |
Health Care Sciences | 3,802 | 0% | 77% |
Hospitality and Tourism | 1,315 | 0% | 70% |
Human Services | 12,423 | 1% | 71% |
Life and Physical Sciences | 200,460 | 14% | 66% |
Manufacturing | 626 | 0% | 87% |
Mathematics | 228,348 | 16% | 63% |
Military Science | 231 | 0% | 73% |
Miscellaneous | 113,879 | 8% | 79% |
Nonsubject Specific | 14,504 | 1% | 82% |
Physical, Health, and Safety Education | 116,638 | 8% | 74% |
Public, Protective, and Government Services | 2,645 | 0% | 75% |
Religious Education and Theology | 174 | 0% | 80% |
Social Sciences and History | 217,683 | 15% | 66% |
Transportation, Distribution, and Logistics | 229 | 0% | 87% |
Total | 1,408,763 | 100% | 69% |
Table C2. 2021-22 Pass Rate Comparison for Virtual Learners for Their Virtual and Non-Virtual Courses by Subject Area
Subject Area | Virtual Pass Rate | Non-Virtual Pass Rate |
|---|---|---|
Agriculture, Food, and Natural Resources | 76% | 80% |
Architecture and Construction | 79% | 82% |
Business and Marketing | 70% | 79% |
Communication and Audio/Visual Technology | 60% | 79% |
Computer and Information Sciences | 75% | 73% |
Engineering and Technology | 83% | 76% |
English Language and Literature | 65% | 70% |
Fine and Performing Arts | 79% | 78% |
Foreign Language and Literature | 59% | 70% |
Health Care Sciences | 77% | 77% |
Hospitality and Tourism | 70% | 79% |
Human Services | 71% | 74% |
Life and Physical Sciences | 66% | 68% |
Manufacturing | 87% | 78% |
Mathematics | 63% | 66% |
Military Science | 73% | 72% |
Miscellaneous | 79% | 73% |
Nonsubject Specific | 82% | 81% |
Physical, Health, and Safety Education | 74% | 75% |
Public, Protective, and Government Services | 75% | 79% |
Religious Education and Theology | 80% | 84% |
Social Sciences and History | 66% | 69% |
Transportation, Distribution, and Logistics | 87% | 77% |
Total | 69% | 71% |
Table C3. 2021-22 Number and Percentage of Virtual Enrollments with Pass Rate by Course Title for the Top 10 Most Enrolled in English Language and Literature Courses
English Language and Literature Course Titles | # of Enrolls | % of Enrolls | Pass Rate |
|---|---|---|---|
English/Language Arts I (9th grade) | 36,437 | 14% | 47% |
English/Language Arts II (10th grade) | 33,707 | 13% | 55% |
English/Language Arts III (11th grade) | 30,792 | 12% | 60% |
English/Language Arts IV (12th grade) | 26,638 | 11% | 65% |
Language Arts (grade 8) | 12,654 | 5% | 68% |
Language Arts (grade 7) | 11,790 | 5% | 70% |
Language Arts (grade 6) | 10,836 | 4% | 75% |
Language Arts (grade 1) | 7,984 | 3% | 83% |
Language Arts (kindergarten) | 7,670 | 3% | 82% |
Language Arts (grade 5) | 7,605 | 3% | 81% |
Total | 186,113 | 74% | 62% |
Note: % of Enrolls based on the overall total of 253,201 for this subject area.
Table C4. 2021-22 Number and Percentage of Virtual Enrollments with Pass Rate by Course Title for the Top 10 Most Enrolled in Mathematics Courses
Mathematics Course Titles | # of Enrolls | % of Enrolls | Pass Rate |
|---|---|---|---|
Geometry | 35,415 | 16% | 54% |
Algebra I | 33,265 | 15% | 45% |
Algebra II | 31,632 | 14% | 60% |
Consumer Mathematics | 12,337 | 5% | 70% |
Mathematics (grade 7) | 11,944 | 5% | 68% |
Mathematics (grade 6) | 11,290 | 5% | 75% |
Mathematics (grade 8) | 9,748 | 4% | 63% |
Mathematics (grade 5) | 7,786 | 3% | 78% |
Mathematics (grade 1) | 7,700 | 3% | 87% |
Mathematics (grade 3) | 7,489 | 3% | 83% |
Total | 168,606 | 74% | 61% |
Note: % of Enrolls based on the overall total of 228,348 for this subject area.
Table C5. 2021-22 Number and Percentage of Virtual Enrollments with Pass Rate by Course Title for the Top 10 Most Enrolled in Life and Physical Sciences Courses
Life and Physical Sciences Course Titles | # of Enrolls | % of Enrolls | Pass Rate |
|---|---|---|---|
Biology | 37,187 | 19% | 53% |
Chemistry | 22,885 | 11% | 59% |
Earth Science | 16,579 | 8% | 54% |
Physical Science | 13,805 | 7% | 56% |
Science (grade 7) | 10,607 | 5% | 72% |
Science (grade 6) | 9,773 | 5% | 77% |
Science (grade 8) | 9,245 | 5% | 68% |
Earth and Space Science | 8,669 | 4% | 60% |
Science (grade 5) | 7,724 | 4% | 80% |
Science (grade 3) | 7,472 | 4% | 82% |
Total | 143,946 | 72% | 62% |
Note: % of Enrolls based on the overall total of 200,460 for this subject area.
Table C6. 2021-22 Number and Percentage of Virtual Enrollments with Pass Rate by Course Title for the Top 10 Most Enrolled in Social Sciences and History Courses
Social Sciences and History Course Titles | # of Enrolls | % of Enrolls | Pass Rate |
|---|---|---|---|
U.S. History—Comprehensive | 26,249 | 12% | 54% |
World History and Geography | 19,414 | 9% | 51% |
Economics | 17,645 | 8% | 64% |
World History—Overview | 13,628 | 6% | 57% |
U.S. Government—Comprehensive | 10,861 | 5% | 61% |
Social Studies (grade 8) | 10,197 | 5% | 67% |
Social Studies (grade 6) | 9,849 | 5% | 75% |
Social Studies (grade 7) | 9,703 | 4% | 74% |
Civics | 8,370 | 4% | 57% |
Psychology | 7,714 | 4% | 69% |
Total | 133,630 | 61% | 61% |
Note: % of Enrolls based on the overall total of 217,683 for this subject area.
Table C7. 2021-22 Number and Percentage of Virtual Enrollments with Pass Rate for AP Courses
AP Course Title | # of Enrolls | % of Enrolls | Pass Rate |
|---|---|---|---|
AP 2-D Art and Design | 38 | 1% | 89% |
AP 3-D Art and Design | 4 | 0% | NR |
AP Art History | 190 | 4% | 62% |
AP Biology | 223 | 4% | 75% |
AP Calculus AB | 205 | 4% | 87% |
AP Calculus BC | 103 | 2% | 79% |
AP Chemistry | 71 | 1% | 68% |
AP Chinese Language and Culture | 11 | 0% | NR |
AP Computer Science A | 258 | 5% | 91% |
AP Computer Science Principles | 34 | 1% | 82% |
AP Drawing | 38 | 1% | 61% |
AP Economics | 58 | 1% | 38% |
AP English Language and Composition | 526 | 10% | 87% |
AP English Literature and Composition | 405 | 8% | 84% |
AP Environmental Science | 158 | 3% | 92% |
AP European History | 60 | 1% | 98% |
AP French Language and Culture | 29 | 1% | 69% |
AP German Language and Culture | 1 | 0% | NR |
AP Government | 31 | 1% | 77% |
AP Human Geography | 73 | 1% | 86% |
AP Macroeconomics | 161 | 3% | 91% |
AP Microeconomics | 149 | 3% | 86% |
AP Music Theory | 40 | 1% | 83% |
AP Physics 1 | 51 | 1% | 78% |
AP Physics 2 | 11 | 0% | NR |
AP Physics C | 51 | 1% | 84% |
AP Physics C: Electricity and Magnetism | 3 | 0% | NR |
AP Physics C: Mechanics | 4 | 0% | NR |
AP Psychology | 860 | 16% | 83% |
AP Seminar | 344 | 6% | 97% |
AP Spanish Language and Culture | 89 | 2% | 73% |
AP Spanish Literature and Culture | 8 | 0% | NR |
AP Statistics | 249 | 5% | 84% |
AP U.S. Government and Politics | 181 | 3% | 81% |
AP U.S. History | 366 | 7% | 83% |
AP World History: Modern | 217 | 4% | 83% |
Total | 5,300 | 100% | 84% |
Note: An additional 446 enrollments had a course type listed as Advanced Placement but did not match an AP SCED Code. Similarly, there existed 34 local course titles with AP in the title that did not have an AP SCED Code. Thus, it is very likely the data above underreports the number of students taking AP courses virtually. Pass Rates are not reported (NR) if there were fewer than 25 for that cell.
Table C8. 2021-22 Virtual Enrollments Percentage by Subject Area and Locale
Subject Area | % Rural | % Town | % Suburb | % City | % Not Specified |
|---|---|---|---|---|---|
Agriculture, Food, and Natural Resources | 0% | 0% | 0% | 0% | 0% |
Architecture and Construction | 0% | 0% | 0% | 0% | 0% |
Business and Marketing | 1% | 1% | 1% | 1% | 0% |
Communication and Audio/Visual Technology | 1% | 0% | 0% | 0% | 2% |
Computer and Information Sciences | 2% | 1% | 2% | 4% | 1% |
Engineering and Technology | 0% | 0% | 0% | 0% | 1% |
English Language and Literature | 19% | 20% | 17% | 17% | 16% |
Fine and Performing Arts | 8% | 7% | 9% | 11% | 12% |
Foreign Language and Literature | 5% | 4% | 4% | 4% | 2% |
Health Care Sciences | 0% | 0% | 0% | 0% | 0% |
Hospitality and Tourism | 0% | 0% | 0% | 0% | 0% |
Human Services | 1% | 2% | 1% | 0% | 1% |
Life and Physical Sciences | 14% | 14% | 14% | 14% | 14% |
Manufacturing | 0% | 0% | 0% | 0% | 0% |
Mathematics | 16% | 17% | 16% | 16% | 15% |
Military Science | 0% | 0% | 0% | 0% | 0% |
Miscellaneous | 7% | 6% | 9% | 9% | 4% |
Nonsubject Specific | 1% | 1% | 1% | 1% | 4% |
Physical, Health, and Safety Education | 9% | 8% | 8% | 8% | 12% |
Public, Protective, and Government Services | 0% | 0% | 0% | 0% | 0% |
Religious Education and Theology | 0% | 0% | 0% | 0% | 0% |
Social Sciences and History | 16% | 17% | 15% | 15% | 15% |
Transportation, Distribution, and Logistics | 0% | 0% | 0% | 0% | 0% |
Total | 100% | 100% | 100% | 100% | 100% |
Table C9. 2021-22 Virtual Enrollment Pass Rates by Subject Area and Locale
Subject Area | Rural Pass Rate | Town Pass Rate | Suburban Pass Rate | City Pass Rate | Not Specified Pass Rate |
|---|---|---|---|---|---|
Agriculture, Food, and Natural Resources | 74% | 75% | 79% | 67% | NR |
Architecture and Construction | 78% | 88% | 76% | 76% | NR |
Business and Marketing | 74% | 77% | 70% | 59% | 72% |
Communication and Audio/Visual Technology | 49% | 66% | 69% | 42% | 74% |
Computer and Information Sciences | 72% | 64% | 79% | 75% | 59% |
Engineering and Technology | 70% | 87% | 86% | 65% | 89% |
English Language and Literature | 64% | 60% | 67% | 68% | 48% |
Fine and Performing Arts | 79% | 59% | 80% | 83% | 71% |
Foreign Language and Literature | 54% | 59% | 61% | 62% | 55% |
Health Care Sciences | 78% | 84% | 73% | 76% | NR |
Hospitality and Tourism | 70% | 79% | 77% | 44% | NR |
Human Services | 72% | 72% | 71% | 65% | 68% |
Life and Physical Sciences | 64% | 58% | 69% | 68% | 49% |
Manufacturing | 91% | 80% | 77% | 77% | NR |
Mathematics | 60% | 56% | 65% | 66% | 46% |
Military Science | NR | NR | 76% | NR | NR |
Miscellaneous | 78% | 68% | 82% | 81% | 58% |
Nonsubject Specific | 87% | 76% | 81% | 70% | 89% |
Physical, Health, and Safety Education | 73% | 69% | 73% | 79% | 77% |
Public, Protective, and Government Services | 79% | 82% | 71% | 83% | NR |
Religious Education and Theology | 69% | NR | 84% | NR | NR |
Social Sciences and History | 65% | 62% | 68% | 69% | 44% |
Transportation, Distribution, and Logistics | 86% | NR | 88% | 89% | NR |
Total | 67% | 61% | 70% | 71% | 57% |
Note: Data are not reported (NR) if there were fewer than 25 virtual enrollments for that cell.
Table C10. 2021-22 Number and Percentage of Virtual Enrollments with Pass Rates by Subject Area and Student Sex
Subject Area | # of Female Enrolls | # of Male Enrolls | % of Female Enrolls | % of Male Enrolls | Female Pass Rate | Male Pass Rate |
|---|---|---|---|---|---|---|
Agriculture, Food, and Natural Resources | 590 | 383 | 0% | 0% | 78% | 74% |
Architecture and Construction | 52 | 341 | 0% | 0% | 83% | 78% |
Business and Marketing | 7,302 | 7,168 | 1% | 1% | 72% | 69% |
Communication and Audio/Visual Technology | 3,334 | 2,788 | 0% | 0% | 61% | 58% |
Computer and Information Sciences | 14,234 | 16,839 | 2% | 2% | 76% | 75% |
Engineering and Technology | 1,176 | 1,609 | 0% | 0% | 84% | 82% |
English Language and Literature | 126,744 | 126,457 | 18% | 18% | 66% | 64% |
Fine and Performing Arts | 65,666 | 63,302 | 9% | 9% | 80% | 78% |
Foreign Language and Literature | 30,461 | 27,360 | 4% | 4% | 61% | 56% |
Health Care Sciences | 2,857 | 945 | 0% | 0% | 79% | 71% |
Hospitality and Tourism | 749 | 566 | 0% | 0% | 70% | 70% |
Human Services | 6,975 | 5,448 | 1% | 1% | 72% | 68% |
Life and Physical Sciences | 100,221 | 100,239 | 14% | 14% | 67% | 65% |
Manufacturing | 155 | 471 | 0% | 0% | 89% | 87% |
Mathematics | 113,874 | 114,474 | 16% | 16% | 63% | 62% |
Military Science | 89 | 142 | 0% | 0% | 80% | 68% |
Miscellaneous | 56,689 | 57,190 | 8% | 8% | 80% | 79% |
Nonsubject Specific | 7,103 | 7,401 | 1% | 1% | 81% | 82% |
Physical, Health, and Safety Education | 58,082 | 58,556 | 8% | 8% | 75% | 74% |
Public, Protective, and Government Services | 1,619 | 1,026 | 0% | 0% | 76% | 73% |
Religious Education and Theology | 115 | 59 | 0% | 0% | 77% | 86% |
Social Sciences and History | 110,865 | 106,818 | 16% | 15% | 67% | 65% |
Transportation, Distribution, and Logistics | 26 | 203 | 0% | 0% | 73% | 89% |
Total | 708,978 | 699,785 | 100% | 100% | 69% | 68% |
Table C11. 2021-22 Number and Percentage of Virtual Enrollments with Pass Rate by Virtual Method
Virtual Method | # of Enrolls | % of Enrolls | Pass Rate |
|---|---|---|---|
Blended Learning | 309,961 | 22% | 89% |
Digital Learning | 94,756 | 7% | 59% |
Online Course | 1,004,046 | 71% | 63% |
Total | 1,408,763 | 100% | 69% |
Appendix D - Student Tables
Note: Clicking on the hyperlinked table number will return to the section of the report that discusses the table.
Table D1. 2021-22 Number and Percentage of Virtual Students with Percent Year over Year Change
Grade Level | # of Students | % of Students | % Change from Prior Year |
|---|---|---|---|
K | 7,325 | 4% | -70% |
1 | 8,184 | 4% | -67% |
2 | 7,806 | 4% | -68% |
3 | 7,884 | 4% | -68% |
4 | 7,563 | 4% | -69% |
5 | 8,467 | 4% | -66% |
6 | 9,279 | 4% | -67% |
7 | 10,121 | 5% | -65% |
8 | 11,450 | 5% | -63% |
9 | 23,217 | 11% | -42% |
10 | 29,379 | 14% | -32% |
11 | 33,031 | 16% | -28% |
12 | 46,018 | 22% | -16% |
Total | 208,460 | 100% | -50% |
Note: Because some students took courses across multiple grade levels, a student may be counted toward more than one grade level. The total row, however, reflects the number of unique students.
Table D2. 2021-22 Number and Percentage of Students and Virtual Enrollments with Pass Rate by Student Sex
Student Sex | # of Students | % of Students | # of Enrolls | % of Enrolls | Pass Rate |
|---|---|---|---|---|---|
Female | 105,223 | 50% | 708,978 | 50% | 69% |
Male | 103,259 | 50% | 699,785 | 50% | 68% |
Total | 208,460 | 100% | 1,408,763 | 100% | 69% |
Note: A few students had enrollments where their sex was listed as male on some but female on others.
Table D3. 2021-22 Number and Percentage of Students and Virtual Enrollments with Pass Rates by Race/Ethnicity
Race /Ethnicity | # of Students | % of Students | # of Enrolls | % of Enrolls | Pass Rate |
|---|---|---|---|---|---|
African American or Black | 52,393 | 25% | 384,135 | 27% | 66% |
American Indian or Alaska Native | 1,325 | 1% | 8,807 | 1% | 55% |
Asian | 5,964 | 3% | 42,766 | 3% | 89% |
Hispanic or Latino | 18,287 | 9% | 129,510 | 9% | 66% |
Native Hawaiian or Pacific Islander | 182 | 0% | 1,234 | 0% | 62% |
White | 116,840 | 56% | 745,031 | 53% | 69% |
Two or More Races | 12,206 | 6% | 89,731 | 6% | 69% |
Unknown | 2,254 | 1% | 7,549 | 1% | 45% |
Total | 208,460 | 100% | 1,408,763 | 100% | 69% |
Note: The sum of the student rows exceeds the 208,461 total number because a few students had enrollments across multiple schools where one school listed the student as one race/ethnicity, but the other school reported a different value. The unique total was used to emphasize the true number of virtual students.
Table D4. 2021-22 Number and Percentage of Students and Virtual Enrollments with Pass Rate by Poverty Status
Poverty Status | # of Students | % of Students | # of Enrolls | % of Enrolls | Pass Rate |
|---|---|---|---|---|---|
Yes | 131,605 | 63% | 963,257 | 68% | 64% |
No | 75,021 | 36% | 436,960 | 31% | 78% |
Unknown | 2,392 | 1% | 8,546 | 1% | 50% |
Total | 208,460 | 100% | 1,408,763 | 100% | 69% |
Table D5. 2021-22 Pass Rate Comparison for Virtual Learners for Their Virtual and Non-Virtual Courses by Poverty Status
Poverty Status | Virtual Pass Rate | Non-Virtual Pass Rate | Virtual Pass Rate - Non-Virtual Pass Rate |
|---|---|---|---|
Yes | 64% | 62% | 2% |
No | 78% | 84% | -5% |
Unknown | 50% | 28% | 22% |
Total | 69% | 71% | -2% |
Note: The Virtual Pass Rate – Non-Virtual Pass Rate calculation was run prior to rounding. That rounding effect accounts for what may appear to be calculation errors.
Table D6. 2021-22 Percentage of Virtual Learners and Virtual Enrollments in Poverty with Pass Rate by Virtual Type
Virtual Type | % of Virtual Learners in Poverty | % of Virtual Enrolls from Learners in Poverty | Pass Rate for Virtual Learners in Poverty |
|---|---|---|---|
Full-Time Virtual | 71% | 73% | 55% |
Part-Time Virtual | 61% | 66% | 70% |
Total | 63% | 68% | 64% |
Table D7. 2021-22 Number and Percentage of Students and Virtual Enrollments by School Free or Reduced-Price Lunch Category
Free or Reduced-Price Lunch Category | # of Virtual Students | # of All MI Students | % of Virtual Students |
|---|---|---|---|
Low FRL (<=25%) | 22,559 | 271,290 | 8% |
Mid-Low FRL (>25% to <=50%) | 51,314 | 432,642 | 12% |
Mid-High FRL (>50% to <=75%) | 60,919 | 381,431 | 16% |
High FRL (>75%) | 75,713 | 312,608 | 24% |
Missing | 1,062 | NA | NA |
Total | 208,460 | 1,443,456 | 14% |
Note: The sum of the student rows exceeds the 208,460 number because some students had enrollments across categories. The unique total was used to emphasize the true number of virtual students. Also, all Michigan K-12 schools with building codes were used to calculate the state figures. The 1.4M total also reflects the number of unique MI K-12 students.
Table D8. 2021-22 Number and Percentage of Students and Virtual Enrollments with Pass Rate by Special Education Status
Special Education Status | # of Students | % of Students | # of Enrolls | % of Enrolls | Pass Rate |
|---|---|---|---|---|---|
Yes | 26,634 | 13% | 188,078 | 13% | 64% |
No | 179,992 | 86% | 1,212,139 | 86% | 69% |
Unknown | 2,392 | 1% | 8,546 | 1% | 50% |
Total | 208,460 | 100% | 1,408,763 | 100% | 69% |
Note: The sum of the student rows exceeds the 208,460 number because some students had enrollments across multiple schools where one school listed the student under a specific special education status, but the other school reported a different status. The unique total was used to emphasize the true number of virtual students.
Table D9. 2021-22 Number and Percentage of Students and Virtual Enrollments with Pass Rate by Primary Disability
Primary Disability | # of Students | % of Students | # of Enrolls | % of Enrolls | Pass Rate |
|---|---|---|---|---|---|
Autism Spectrum Disorder | 2,115 | 8% | 14,681 | 8% | 75% |
Cognitive Impairment | 1,495 | 6% | 9,603 | 5% | 65% |
Deaf-Blindness | NR | 0% | NR | 0% | NR |
Early Childhood Developmental Delay | 133 | 0% | 1,021 | 1% | 80% |
Emotional Impairment | 2,856 | 11% | 20,737 | 11% | 50% |
Hearing Impairment | 223 | 1% | 1,471 | 1% | 71% |
Other Health Impairment | 5,141 | 19% | 36,397 | 19% | 60% |
Physical Impairment | 112 | 0% | 810 | 0% | 82% |
Severe Multiple Impairment | 117 | 0% | 211 | 0% | 81% |
Specific Learning Disability | 9,903 | 37% | 68,117 | 36% | 60% |
Speech & Language Impairment | 3,805 | 14% | 29,050 | 15% | 84% |
Traumatic Brain Injury | NR | 0% | NR | 0% | 63% |
Visual Impairment | 85 | 0% | 546 | 0% | 78% |
MISSING/None-Listed | 741 | 3% | 4,975 | 3% | 33% |
Total | 26,634 | 100% | 188,078 | 100% | 64% |
Note: The sum of the student rows exceeds the 26,634 number because some students had enrollments across multiple schools where one school listed the student with a specific primary disability, but the other school reported a different primary disability. The unique total was used to emphasize the true number of virtual students. Additionally, data are not reported (NR) out of caution for confidentiality.
Table D10. 2021-22 Number and Percentage of Virtual Students Compared to All MI Students with IEPs by Primary Disability
Primary Disability | # of Virtual Students | # of All MI Students with IEPs | % of All MI Students with IEPs Who Took a Virtual Course | % of All MI Students with IEPs |
|---|---|---|---|---|
Autism Spectrum Disorder | 2,115 | 23,092 | 9% | 11% |
Cognitive Impairment | 1,495 | 16,410 | 9% | 8% |
Deaf-Blindness | NR | NR | NR | NR |
Early Childhood Developmental Delay | 133 | 7,722 | 2% | 4% |
Emotional Impairment | 2,856 | 10,272 | 28% | 5% |
Hearing Impairment | 223 | 2,278 | 10% | 1% |
Other Health Impairment | 5,141 | 29,258 | 18% | 14% |
Physical Impairment | 112 | 1,418 | 8% | 1% |
Severe Multiple Impairment | 117 | 2,815 | 4% | 1% |
Specific Learning Disability | 9,903 | 54,238 | 18% | 27% |
Speech & Language Impairment | 3,805 | 54,883 | 7% | 27% |
Traumatic Brain Injury | NR | NR | NR | NR |
Visual Impairment | 85 | 741 | 11% | 0% |
MISSING/None-Listed | 741 | NA | NA | NA |
Total | 26,634 | 203,585 | 13% | 100% |
Note: The sum of the student rows exceeds the 26,634 number because some students had enrollments across multiple schools where one school listed the student with a specific primary disability, but the other school reported a different primary disability. The unique total was used to emphasize the true number of virtual students. Additionally, data are not reported (NR) out of caution for confidentiality.
Table D11. 2021-22 Number and Percentage of Virtual Enrollments by Home-School/Nonpublic Student Status
Home-School or Nonpublic Student Status | # of Students | % of Students | # of Enrolls | % of Enrolls | Pass Rate |
|---|---|---|---|---|---|
No | 203,952 | 98% | 1,387,555 | 98% | 68% |
Yes | 4,527 | 2% | 21,208 | 2% | 94% |
Total | 208,460 | 100% | 1,408,763 | 100% | 69% |
Note: The sum of the student rows exceeds the 208,460 number because a few students had enrollments that were recorded. The unique total was used to emphasize the true number of virtual students.
Table D12. 2021-22 Number and Percentage of Virtual Enrollments with Pass Rate by Full- or Part-Time Status
Virtual Subset | # of Students | % of Students | # of Enrolls | % of Enrolls | Pass Rate |
|---|---|---|---|---|---|
Full-Time Virtual | 52,198 | 25% | 502,284 | 36% | 59% |
Part-Time Virtual | 158,549 | 76% | 906,479 | 64% | 74% |
Total | 208,460 | 100% | 1,408,763 | 100% | 69% |
Note: The sum of the student rows exceeds the 208,460 number because some students had enrollments in both full-time and part-time virtual schools. The unique total was used to emphasize the true number of virtual students.
Table D13. 2021-22 Pass Rate Comparison for Full- and Part-Time Virtual Learners
Virtual Subset | Virtual Pass Rate | Non-Virtual Pass Rate |
|---|---|---|
Full-Time Virtual | 59% | 84% |
Part-Time Virtual | 74% | 71% |
Total | 69% | 71% |
Note: There were 23,374 non-virtual enrollments reported for Full-Time Virtual students.
Table D14. 2021-22 Number and Percentage of Virtual Enrollments with Pass Rates by Students' Percentage of Enrollments Delivered Virtually
% of Enrollments an Individual Student Took Virtually | # of Students | % of Students | # of Enrolls | % of Enrolls | Pass Rate |
|---|---|---|---|---|---|
<25% of Enrolls Virtual | 63,312 | 30% | 107,126 | 8% | 72% |
25% to 49% of Enrolls Virtual | 27,308 | 13% | 141,379 | 10% | 57% |
50% to 74% of Enrolls Virtual | 18,867 | 9% | 167,332 | 12% | 55% |
75% or More of Enrolls Virtual | 98,973 | 47% | 992,926 | 70% | 72% |
Total | 208,460 | 100% | 1,408,763 | 100% | 69% |
Table D15. 2021-22 Number and Percentage of Virtual Enrollments from LEA Schools Only with Pass Rates by Students' Percentage of Enrollments Delivered Virtually
% of Enrollments Delivered Virtually | # of Students | % of Students | # of Enrolls | % of Enrolls | Pass Rate |
|---|---|---|---|---|---|
<25% of Enrolls Virtual | 59,423 | 41% | 97,962 | 12% | 74% |
25% to 49% of Enrolls Virtual | 22,747 | 16% | 111,886 | 14% | 60% |
50% to 74% of Enrolls Virtual | 13,623 | 9% | 115,314 | 14% | 56% |
75% or More of Enrolls Virtual | 49,236 | 34% | 502,965 | 61% | 66% |
Total | 145,029 | 100% | 828,127 | 100% | 65% |
Table D16. 2021-22 Number and Percentage of Virtual Enrollments from PSA Schools Only with Pass Rates by Students' Percentage of Enrollments Delivered Virtually
% of Enrollments Delivered Virtually | # of Students | % of Students | # of Enrolls | % of Enrolls | Pass Rate |
|---|---|---|---|---|---|
<25% of Enrolls Virtual | 3,367 | 5% | 6,393 | 1% | 63% |
25% to 49% of Enrolls Virtual | 1,929 | 3% | 9,298 | 2% | 48% |
50% to 74% of Enrolls Virtual | 1,898 | 3% | 14,602 | 3% | 53% |
75% or More of Enrolls Virtual | 55,351 | 88% | 533,985 | 95% | 75% |
Total | 62,545 | 100% | 564,278 | 100% | 74% |
Table D17. 2021-22 Number and Percentage of Virtual Enrollments with Pass Rates by District Mobility
District Mobility | # of Enrolls | % of Enrolls | Pass Rate |
|---|---|---|---|
Stable | 1,215,639 | 86% | 74% |
Incoming | 63,381 | 4% | 49% |
Outgoing | 122,194 | 9% | 31% |
Missing | 7,549 | 1% | 45% |
Total | 1,408,763 | 100% | 69% |
Table D18. 2021-22 Number and Percentage of Virtual Enrollments with Pass Rates by District Mobility and Known Poverty Status
District Mobility | # of In Poverty Enrolls | # of Not In Poverty Enrolls | % of In Poverty Enrolls | % of Not In Poverty Enrolls | In Poverty | Not In Poverty |
|---|---|---|---|---|---|---|
Stable | 814,791 | 399,894 | 85% | 92% | 70% | 82% |
Incoming | 51,757 | 11,624 | 5% | 3% | 47% | 55% |
Outgoing | 96,709 | 25,442 | 10% | 6% | 28% | 40% |
Total | 963,257 | 436,960 | 100% | 100% | 64% | 78% |
Note: Table excludes 8,546 enrollments that had an Unknown for the PovertyFlag variable.
Table D19. 2021-22 Percentage of Virtual Enrollments by District Mobility and Locale
District Mobility | % of Rural Enrolls | % of Town Enrolls | % of Suburban Enrolls | % of City Enrolls | % of Not Specified Enrolls |
|---|---|---|---|---|---|
Stable | 85% | 81% | 88% | 87% | 89% |
Incoming | 6% | 6% | 4% | 3% | 3% |
Outgoing | 9% | 13% | 7% | 10% | 7% |
Missing | 0% | 0% | 1% | 1% | 1% |
Total | 100% | 100% | 100% | 100% | 100% |
Table D20. 2021-22 Virtual Pass Rates by District Mobility and Locale
District Mobility | Rural Pass Rate | Town Pass Rate | Suburban Pass Rate | City Pass Rate | Not Specified Pass Rate |
|---|---|---|---|---|---|
Stable | 73% | 67% | 75% | 76% | 60% |
Incoming | 44% | 43% | 54% | 45% | 54% |
Outgoing | 19% | 31% | 30% | 44% | 21% |
Missing | 31% | 65% | 56% | 35% | 38% |
Total | 67% | 61% | 70% | 71% | 57% |
Table D21. 2021-22 Percentage of Virtual Enrollments with Pass Rates by District Mobility and Full-Time (FT) or Part-Time (PT) Virtual Status
District Mobility | % of FT Enrolls | % of PT Enrolls | FT Pass Rate | PT Pass Rate |
|---|---|---|---|---|
Stable | 80% | 90% | 66% | 77% |
Incoming | 9% | 2% | 46% | 54% |
Outgoing | 11% | 7% | 27% | 34% |
Missing | 0% | 1% | 24% | 53% |
Total | 100% | 100% | 59% | 74% |
Table D22. 2021-22 Number and Percentage of Part-Time Virtual Students and Virtual Enrollments with Pass Rate by Non-Virtual Performance (Minimum of 3 Non-Virtual Enrollments)
Non-Virtual Performance | # of Students | % of Students | # of Enrolls | % of Enrolls | Pass Rate |
|---|---|---|---|---|---|
Passed All NV Courses | 45,467 | 42% | 148,395 | 33% | 78% |
Did Not Pass 1 or 2 NV Courses | 19,847 | 18% | 68,062 | 15% | 68% |
Did Not Pass 3 or More NV Courses | 43,787 | 40% | 232,789 | 52% | 46% |
Total | 109,101 | 100% | 449,246 | 100% | 60% |
Table D23. 2021-22 Number and Percentage of Students and Virtual Enrollments by Virtual Course Performance
Virtual Course Performance | # of Students | % of Students | # of Enrolls | % of Enrolls | Pass Rate |
|---|---|---|---|---|---|
Passed All | 117,588 | 56% | 675,116 | 48% | 100% |
Passed Some, But Not All | 55,519 | 27% | 546,374 | 39% | 53% |
Didn't Pass Any | 35,353 | 17% | 187,273 | 13% | 0% |
Total | 208,460 | 100% | 1,408,763 | 100% | 69% |
Table D24. 2021-22 Number and Percentage of Virtual Students Who Did Not Pass Any Virtual Courses by the Number of Virtual Courses They Took
# of Virtual Courses Not Passed | # of Students | % of Students |
|---|---|---|
1 to 2 | 12,681 | 36% |
3 to 4 | 4,564 | 13% |
5 to 6 | 7,522 | 21% |
7 to 8 | 3,705 | 10% |
9 to 10 | 1,832 | 5% |
11+ | 5,049 | 14% |
Total | 35,353 | 100% |
Table D25. 2021-22 Number and Percentage of Students and Virtual Enrollments with Pass Rates by Virtual Usage
Virtual Usage | # of Students | % of Students | # of Enrolls | % of Enrolls | Pass Rate |
|---|---|---|---|---|---|
1 to 2 Virtual Courses | 62,029 | 30% | 86,728 | 6% | 77% |
3 to 4 Virtual Courses | 23,101 | 11% | 80,373 | 6% | 68% |
5 or More Virtual Courses | 123,330 | 59% | 1,241,662 | 88% | 68% |
Total | 208,460 | 100% | 1,408,763 | 100% | 69% |
Appendix E - State Assessment Tables
Note: Clicking on the hyperlinked table number will return to the section of the report that discusses the table.
Table E1. 2021-22 Comparison of Virtual and State Proficiency Rates on 11th Grade State Assessment Measures
Assessment | Virtual Learners | All Learners Statewide |
|---|---|---|
Evidence-Based Reading & Writing (SAT) | 40% | 52% |
Mathematics (SAT) | 19% | 30% |
Science (M-STEP) | 31% | 38% |
Social Studies (M-STEP) | 27% | 36% |
Note: Statewide assessment data were available from the MI School Data Portal. SAT measures are on the College Readiness report. The M-STEP measures can be found on the High School State Testing Performance report.
Table E2. 2021-22 State Assessment Proficiency Rates for Virtual Learners with Three or More Non-Virtual Enrollments by Non-Virtual Performance
Assessment | Pass All NV | Did Not Pass 1 or 2 NV | Did Not Pass 3 or More NV |
|---|---|---|---|
Evidence-Based Reading & Writing (SAT) | 62% | 35% | 20% |
Mathematics (SAT) | 37% | 14% | 6% |
Science (M-STEP) | 46% | 25% | 15% |
Social Studies (M-STEP) | 42% | 23% | 13% |
Table E3. 2021-22 State Assessment Proficiency Rates for Virtual Learners by Poverty Status
Assessment | In Poverty | Not In Poverty | All Virtual Learners |
|---|---|---|---|
Evidence-Based Reading & Writing (SAT) | 26% | 56% | 40% |
Mathematics (SAT) | 8% | 31% | 19% |
Science (M-STEP) | 20% | 42% | 31% |
Social Studies (M-STEP) | 17% | 39% | 27% |
Table E4. 2021-22 State Assessment Proficiency Rates for Virtual Learners by Virtual Type
Assessment | Part-Time | Full-Time | All Virtual Learners |
|---|---|---|---|
Evidence-Based Reading & Writing (SAT) | 41% | 32% | 40% |
Mathematics (SAT) | 21% | 9% | 19% |
Science (M-STEP) | 31% | 29% | 31% |
Social Studies (M-STEP) | 28% | 23% | 27% |
Appendix F - Higher Performing Schools Tables
Note: Clicking on the hyperlinked table number will return to the section of the report that discusses the table.
Table F1. 2021-22 Number and Percentage of Schools with 80% or Higher Pass Rate by Virtual Learner Count Category
Virtual Learner Count | School Count | % of Schools |
|---|---|---|
10 or Fewer | 249 | 35% |
11 to 25 | 100 | 14% |
26 to 50 | 88 | 12% |
51 to 99 | 78 | 11% |
100 or More | 190 | 27% |
Total | 705 | 100% |
Table F2. 2021-22 Number and Percentage of Schools and Virtual Enrollments from Schools with 80% or Higher Pass Rate by Virtual Count Category
Virtual Enroll Count | # of Schools | % of Schools | # of Virtual Enrolls | % of Virtual Enrolls |
|---|---|---|---|---|
1 to 9 | 104 | 15% | 462 | 0% |
10 to 29 | 99 | 14% | 1,634 | 0% |
30 to 49 | 58 | 8% | 2,226 | 0% |
50 to 99 | 102 | 14% | 7,454 | 1% |
100 or More | 342 | 49% | 501,379 | 98% |
Total | 705 | 100% | 513,155 | 100% |
Table F3. 2021-22 Number and Percentage of Schools with 80% or Higher Pass Rate by Number of Virtual Courses Offered
Virtual Courses Offered | # of Schools | % of Schools |
|---|---|---|
10 or Fewer | 250 | 35% |
11 to 25 | 183 | 26% |
26 to 50 | 138 | 20% |
More than 50 | 134 | 19% |
Total | 705 | 100% |
Table F4. 2021-22 Number and Percentage of Schools with 80% or Higher Pass Rate as a Percentage of All Virtual Schools
Entity Type | # of Higher Performing Schools | # of Virtual Schools | % of Virtual Schools |
|---|---|---|---|
ISD School | 12 | 29 | 41% |
ISD Unique Education Provider | NR | NR | NR |
LEA School | 597 | 1,685 | 35% |
LEA Unique Education Provider | NR | NR | NR |
PSA School | 88 | 184 | 48% |
State School | NR | NR | NR |
Total | 705 | 1,914 | 37% |
Note: Data are not reported (NR) out of caution for confidentiality.
Table F5. 2021-22 Number and Percentage of Schools with 80% or Higher Pass Rate by Locale
Locale | # of Higher Performing Schools | # of Virtual Schools | % of Virtual Schools |
|---|---|---|---|
Rural | 222 | 589 | 38% |
Town | 76 | 251 | 30% |
Suburb | 305 | 695 | 44% |
City | 99 | 369 | 27% |
Not Specified | 3 | 10 | 30% |
Total | 705 | 1,914 | 37% |
Table F6. 2021-22 Number of Students and Virtual Enrollments with Pass Rate Data from Schools with 80% or Higher Pass Rate by Race/Ethnicity
Race/Ethnicity | # of Students | # of Pass | # of Enrolls | Pass Rate |
|---|---|---|---|---|
African American or Black | 18,081 | 131,989 | 137,072 | 96% |
American Indian or Alaska Native | 331 | 1,995 | 2,210 | 90% |
Asian | 3,706 | 27,386 | 28,095 | 97% |
Hispanic or Latino | 6,699 | 44,522 | 47,515 | 94% |
Native Hawaiian or Pacific Islander | NR | NR | NR | NR |
Two or More Races | 4,655 | 32,979 | 35,058 | 94% |
Unknown | NR | NR | NR | NR |
White | 43,016 | 240,572 | 261,632 | 92% |
Total | 76,894 | 480,640 | 513,155 | 94% |
Note: Data are not reported (NR) out of caution for confidentiality.
Table F7. 2021-22 Number of Students and Virtual Enrollments with Pass Rate Data from Schools with 80% or Higher Pass Rate by Poverty Status
Poverty Status | # of Students | % of Students | # of Pass | # of Enrolls | % of Enrolls | Pass Rate |
|---|---|---|---|---|---|---|
Y | 43,118 | 56% | 289,016 | 310,757 | 61% | 93% |
N | 33,411 | 43% | 190,776 | 201,200 | 39% | 95% |
Unknown | 404 | 1% | 848 | 1,198 | 0% | 71% |
Total | 76,894 | 100% | 480,640 | 513,155 | 100% | 94% |
Table F8. 2021-22 Number and Percentage of Schools with 80% or Higher Pass Rate by School Free or Reduced-Price Lunch Category
Free or Reduced-Price Lunch Category | # of Higher Performing Schools | % of Higher Performing Schools | # of All Virtual Schools | % of All Virtual Schools |
|---|---|---|---|---|
Low FRL (<=25%) | 116 | 16% | 232 | 50% |
Mid-Low FRL (>25% to <=50%) | 240 | 34% | 552 | 43% |
Mid-High FRL (>50% to <=75%) | 211 | 30% | 614 | 34% |
High FRL (>75%) | 127 | 18% | 486 | 26% |
Missing | 11 | 2% | 30 | 37% |
Total | 705 | 100% | 1,914 | 37% |
Table F9. 2021-22 Number and Percentage of Schools with 80% or Higher Pass Rate by Full- or Part-Time Status
Full- or Part-Time Status | # of Higher Performing Schools | % of Higher Performing Schools | # of All Virtual Schools | % of All Virtual Schools |
|---|---|---|---|---|
Full-Time | 17 | 2% | 94 | 18% |
Part-Time | 688 | 98% | 1,820 | 38% |
Total | 705 | 100% | 1,914 | 37% |
Table F10. 2021-22 Number and Percentage of Schools with 80% or Higher Pass Rate by School Emphasis
School Emphasis | # of Higher Performing Schools | # of All Virtual Schools | % of All Virtual Schools |
|---|---|---|---|
Alternative Education | 36 | 277 | 13% |
General Education | 658 | 1,606 | 41% |
Special Education | NR | NR | NR |
Vocational/CTE | NR | NR | NR |
Total | 705 | 1,914 | 37% |
Note: Data are not reported (NR) out of caution for confidentiality.
Table F11. 2021-22 Number and Percentage of Students* from Schools with 80% or Higher Pass Rate by Pass Rate Difference Category
Pass Rate Difference Category | # of Students | % of Students |
|---|---|---|
Virtual Less than Non-Virtual | 1,886 | 16% |
Virtual Met/Exceeded Non-Virtual | 10,064 | 84% |
Total | 11,950 | 100% |
* Note: Only virtual learners who took a minimum of three virtual courses and three non-virtual courses are included in the table.
Appendix G - Completion Status Tables
Note: Clicking on the hyperlinked table number will return to the section of the report that discusses the table.
Table G1. 2021-22 Number and Percentage of Virtual Enrollments by Completion Status
Completion Status | # of Enrolls | % of Enrolls |
|---|---|---|
Audited | 1,460 | 0% |
Completed/Failed | 184,647 | 13% |
Completed/Passed | 965,076 | 69% |
Incomplete | 87,802 | 6% |
Ongoing Enrolled | 43 | 0% |
Testing Out | 303 | 0% |
Withdrawn/Exited | 111,442 | 8% |
Withdrawn/Failing | 14,994 | 1% |
Withdrawn/Passing | 42,996 | 3% |
Total | 1,408,763 | 100% |
Table G2. 2021-22 Percentage of Virtual Enrollments by Completion Status and Entity Type
Completion Status | ISD School % of Enrolls | ISD UEP % of Enrolls | LEA School % of Enrolls | LEA UEP % of Enrolls | PSA School % of Enrolls |
|---|---|---|---|---|---|
Audited | 0% | 0% | 0% | 0% | 0% |
Completed/Failed | 6% | 14% | 16% | 7% | 9% |
Completed/Passed | 67% | 83% | 65% | 78% | 74% |
Incomplete | 4% | 1% | 7% | 1% | 6% |
Ongoing Enrolled | 0% | 0% | 0% | 0% | 0% |
Testing Out | 0% | 0% | 0% | 0% | 0% |
Withdrawn/Exited | 13% | 2% | 9% | 12% | 6% |
Withdrawn/Failing | 3% | 0% | 1% | 0% | 2% |
Withdrawn/Passing | 7% | 1% | 3% | 1% | 3% |
Total | 100% | 100% | 100% | 100% | 100% |
Note: UEP = Unique Education Provider. State School omitted due to limited enrollments.
Table G3. 2021-22 Number and Percentage of Full-Time Virtual Enrollments by Completion Status
Completion Status | # of Enrolls | % of Enrolls |
|---|---|---|
Audited | 303 | 0% |
Completed/Failed | 76,710 | 15% |
Completed/Passed | 298,353 | 59% |
Incomplete | 49,632 | 10% |
Ongoing Enrolled | 8 | 0% |
Testing Out | 88 | 0% |
Withdrawn/Exited | 44,593 | 9% |
Withdrawn/Failing | 11,330 | 2% |
Withdrawn/Passing | 21,267 | 4% |
Total | 502,284 | 100% |
Table G4. 2021-22 Number and Percentage of Part-Time Virtual Enrollments by Completion Status
Completion Status | # of Enrolls | % of Enrolls |
|---|---|---|
Audited | 1,157 | 0% |
Completed/Failed | 107,937 | 12% |
Completed/Passed | 666,723 | 74% |
Incomplete | 38,170 | 4% |
Ongoing Enrolled | 35 | 0% |
Testing Out | 215 | 0% |
Withdrawn/Exited | 66,849 | 7% |
Withdrawn/Failing | 3,664 | 0% |
Withdrawn/Passing | 21,729 | 2% |
Total | 906,479 | 100% |
Table G5. 2021-22 Percentage of Virtual Enrollments by Completion Status and School Emphasis
Completion Status | Alt Ed % of Enrolls | Gen Ed % of Enrolls | Special Ed % of Enrolls |
|---|---|---|---|
Audited | 0% | 0% | 0% |
Completed/Failed | 16% | 12% | 8% |
Completed/Passed | 50% | 76% | 59% |
Incomplete | 18% | 2% | 5% |
Ongoing Enrolled | 0% | 0% | 0% |
Testing Out | 0% | 0% | 0% |
Withdrawn/Exited | 13% | 6% | 27% |
Withdrawn/Failing | 1% | 1% | 0% |
Withdrawn/Passing | 2% | 3% | 1% |
Total | 100% | 100% | 100% |
Note: Reportable Programs and Vocational/CTE are not reported here because each had fewer than 10 schools.
Table G6. 2021-22 Percentage of Virtual Enrollments by Completion Status and Core Subject Area
Completion Status | English % of Enrolls | Math % of Enrolls | Science % of Enrolls | Social Sci % of Enrolls |
|---|---|---|---|---|
Audited | 0% | 0% | 0% | 0% |
Completed/Failed | 14% | 16% | 14% | 14% |
Completed/Passed | 65% | 63% | 66% | 66% |
Incomplete | 7% | 8% | 7% | 7% |
Ongoing Enrolled | 0% | 0% | 0% | 0% |
Testing Out | 0% | 0% | 0% | 0% |
Withdrawn/Exited | 8% | 9% | 8% | 8% |
Withdrawn/Failing | 1% | 1% | 1% | 1% |
Withdrawn/Passing | 3% | 3% | 3% | 3% |
Total | 100% | 100% | 100% | 100% |
Table G7. 2021-22 Percentage of Virtual Enrollments by Completion Status and Student Sex
Completion Status | Females % of Enrolls | Males % of Enrolls |
|---|---|---|
Audited | 0% | 0% |
Completed/Failed | 12% | 14% |
Completed/Passed | 69% | 68% |
Incomplete | 6% | 6% |
Ongoing Enrolled | 0% | 0% |
Testing Out | 0% | 0% |
Withdrawn/Exited | 8% | 8% |
Withdrawn/Failing | 1% | 1% |
Withdrawn/Passing | 3% | 3% |
Total | 100% | 100% |
Table G8. 2021-22 Percentage of Virtual Enrollments by Completion Status and Race / Ethnicity
Completion Status | African American or Black % of Enrolls | American Indian or Alaska Native % of Enrolls | Asian % of Enrolls | Hispanic or Latino % of Enrolls | White % of Enrolls | Two or More Races % of Enrolls | Unknown % of Enrolls |
|---|---|---|---|---|---|---|---|
Audited | 0% | 0% | 0% | 0% | 0% | 0% | 0% |
Completed/Failed | 14% | 22% | 4% | 13% | 13% | 13% | 13% |
Completed/Passed | 66% | 55% | 89% | 66% | 69% | 69% | 45% |
Incomplete | 5% | 9% | 1% | 9% | 7% | 6% | 11% |
Ongoing Enrolled | 0% | 0% | 0% | 0% | 0% | 0% | 0% |
Testing Out | 0% | 0% | 0% | 0% | 0% | 0% | 0% |
Withdrawn/Exited | 10% | 9% | 4% | 8% | 7% | 7% | 28% |
Withdrawn/Failing | 1% | 2% | 0% | 1% | 1% | 1% | 1% |
Withdrawn/Passing | 3% | 2% | 2% | 3% | 3% | 4% | 2% |
Total | 100% | 100% | 100% | 100% | 100% | 100% | 100% |
Note: Only Race / Ethnicities with 1,000 or more students are reported in the table.
Table G9. 2021-22 Number and Percentage of Virtual Enrollments by Completion Status and Poverty Status
Completion Status | In Poverty % of Enrolls | Not In Poverty % of Enrolls | Unknown % of Enrolls |
|---|---|---|---|
Audited | 0% | 0% | 0% |
Completed/Failed | 15% | 9% | 12% |
Completed/Passed | 64% | 78% | 50% |
Incomplete | 7% | 4% | 10% |
Ongoing Enrolled | 0% | 0% | 0% |
Testing Out | 0% | 0% | 0% |
Withdrawn/Exited | 9% | 5% | 25% |
Withdrawn/Failing | 1% | 1% | 1% |
Withdrawn/Passing | 3% | 3% | 3% |
Total | 100% | 100% | 100% |
Table G10. 2021-22 Number and Percentage of Virtual Enrollments by Completion Status and Special Education Status
Completion Status | In Special Ed % of Enrolls | Not In Special Ed % of Enrolls | Unknown % of Enrolls |
|---|---|---|---|
Audited | 0% | 0% | 0% |
Completed/Failed | 16% | 13% | 12% |
Completed/Passed | 64% | 69% | 50% |
Incomplete | 6% | 6% | 10% |
Ongoing Enrolled | 0% | 0% | 0% |
Testing Out | 0% | 0% | 0% |
Withdrawn/Exited | 10% | 8% | 25% |
Withdrawn/Failing | 1% | 1% | 1% |
Withdrawn/Passing | 3% | 3% | 3% |
Total | 100% | 100% | 100% |
Table G11. 2021-22 Percentage of Virtual Enrollments by Completion Status for Students Who Did Not Pass Any of Their Virtual Courses
Completion Status | At Least One % of Enrolls | 11 or More % of Enrolls |
|---|---|---|
Audited | 0% | 0% |
Completed/Failed | 35% | 39% |
Completed/Passed | 0% | 0% |
Incomplete | 17% | 23% |
Ongoing Enrolled | 0% | 0% |
Testing Out | 0% | 0% |
Withdrawn/Exited | 30% | 24% |
Withdrawn/Failing | 5% | 4% |
Withdrawn/Passing | 13% | 10% |
Total | 100% | 100% |