In April 2017, the National Education Policy Center (NEPC), released its fifth annual report on virtual schools in the U.S, Virtual Schools in the U.S. 2017. In it, the authors provide “objective analysis of the characteristics and performance of full-time, publicly funded K-12 virtual schools; available research on virtual school practices and policy; and an overview of recent state efforts to craft new policy.” (Molnar, 2017, p. 3) The full report is available free online at http://nepc.colorado.edu/publication/virtual-schools-annual-2017.
In Section I of the report, authors Gary Miron, Charisse Gulosino, Christopher Shank, and Caryn K. Davidson state that virtual schools served a higher proportion of girls than boys and “[r]elative to national public school enrollment, virtual schools had substantially fewer minority students and fewer lower-income students.” (Miron, et. Al, 2017, p. 3) Additionally, the research team found that the proportion of special education students and students with disabilities in virtual schools was close to the national average for all U.S. public schools. Lastly, the proportion of students classified as English Language Learners enrolled in virtual schools nationwide was considerably less than the proportion in all public schools.
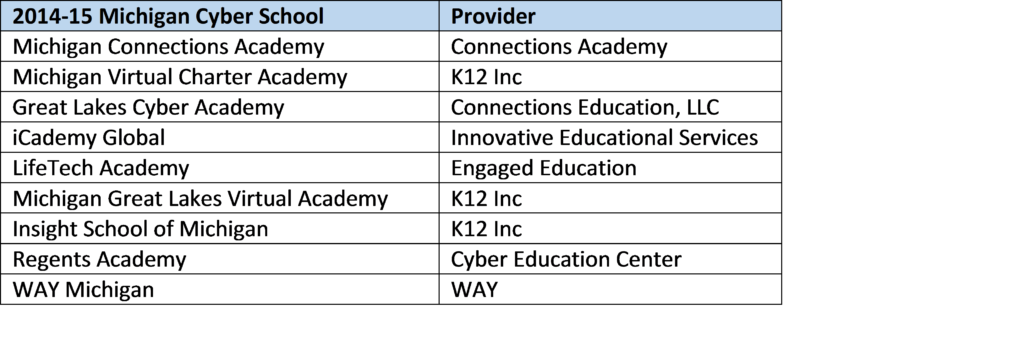
Given that these findings were based on national data, the research team at MVLRI was interested in how those general findings aligned with virtual schools within the state of Michigan. (A similar analysis was performed by MVLRI in 2015) To find out, MVLRI used the MI School Data website (https://mischooldata.org) to look up these same metrics using information available to the public. MVLRI researched nine schools identified by the state of Michigan as statewide cyber schools for which there was data available for the 2014-15 school year. These nine schools were:
National Finding #1 – Virtual schools were skewed in favor of girls.
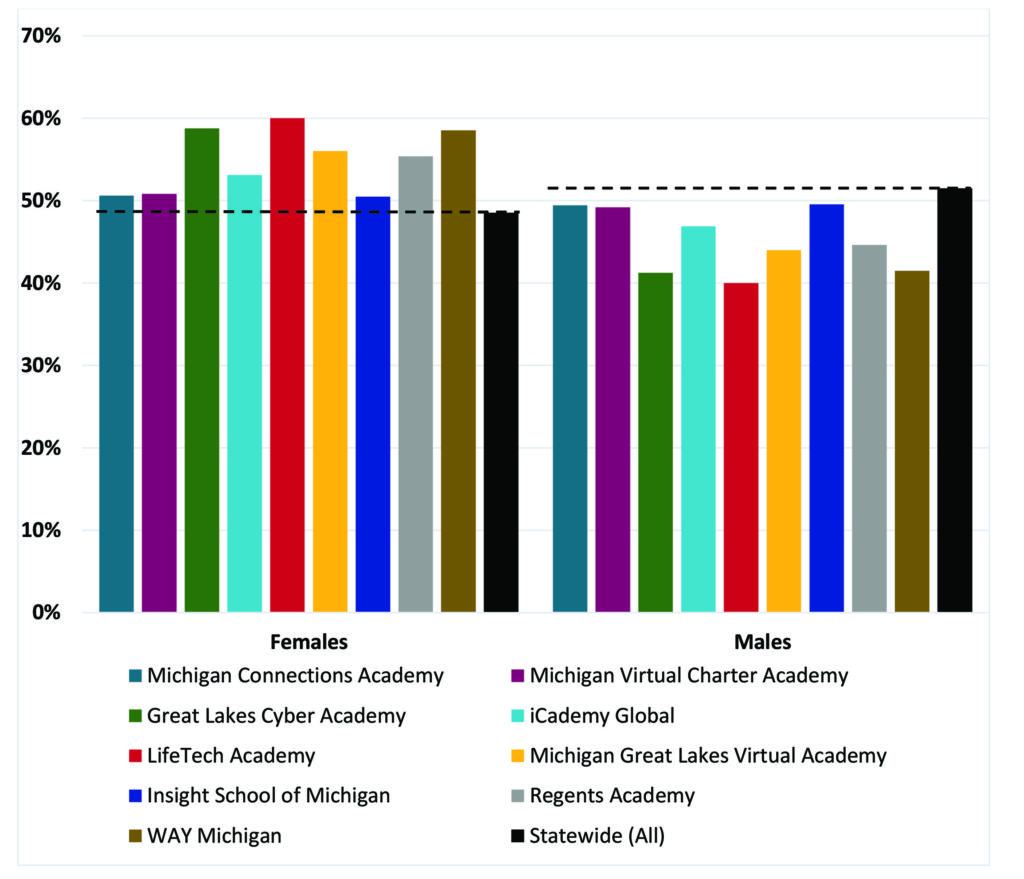
Michigan Finding #1 – Based on data for the 2014-15 school year, all nine virtual schools had higher proportions of female students than the statewide average. See Figure 1.
Figure 1. Gender Distribution of Michigan Cyber School Students by School
National Finding #2 – Virtual schools had substantially fewer minority students.
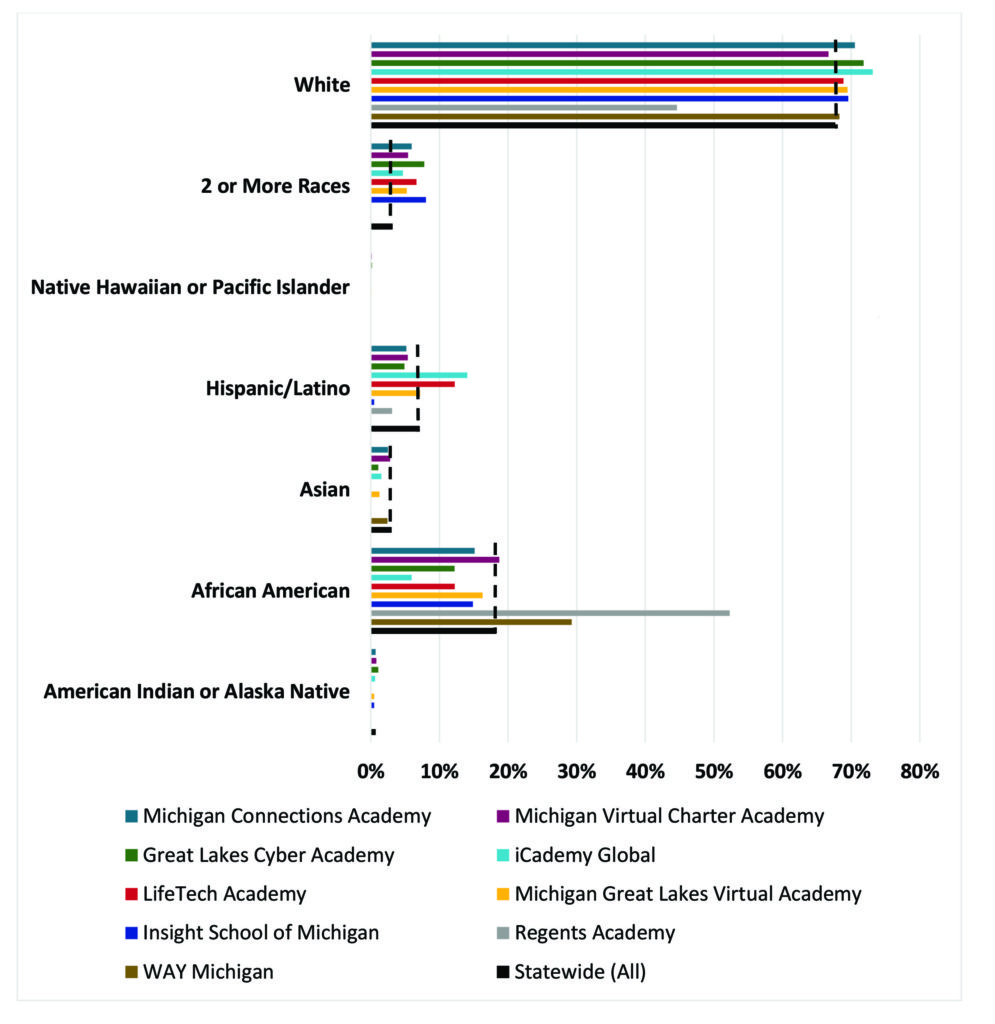
Michigan Finding #2 – Based on data for the 2014-15 school year, eight of the nine virtual schools had fewer minority students than the statewide average. See Figure 2.
Figure 2. Race/Ethnicity Distribution of Michigan Cyber School Students by School
National Finding #3 – Virtual schools had fewer low-income students.
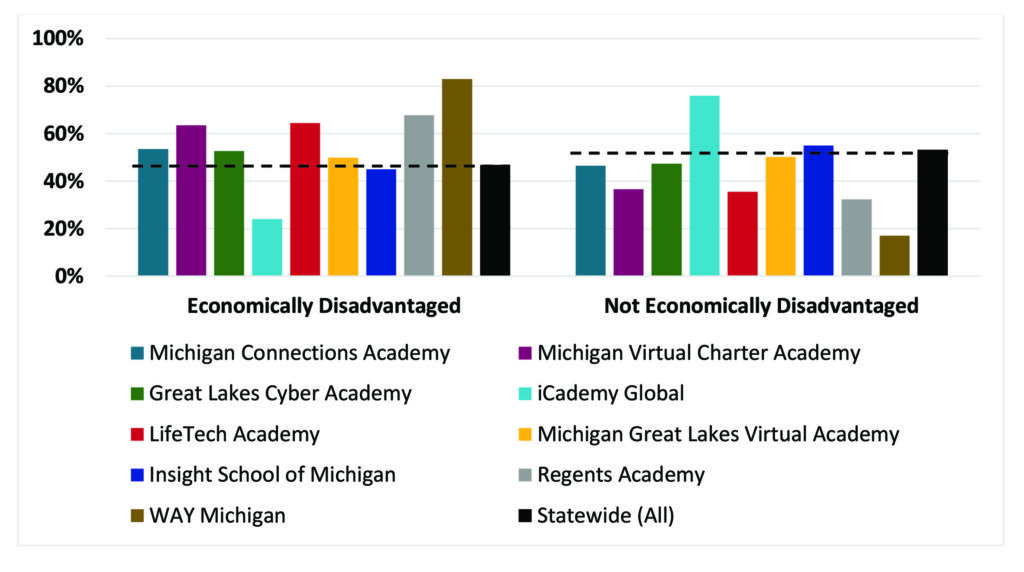
Michigan Finding #3 – Based on data for the 2014-15 school year, seven of the nine virtual schools had higher proportions of low-income students than the statewide average. See Figure 3.
Figure 3. Economically Disadvantaged Distribution of Michigan Cyber School Students by School
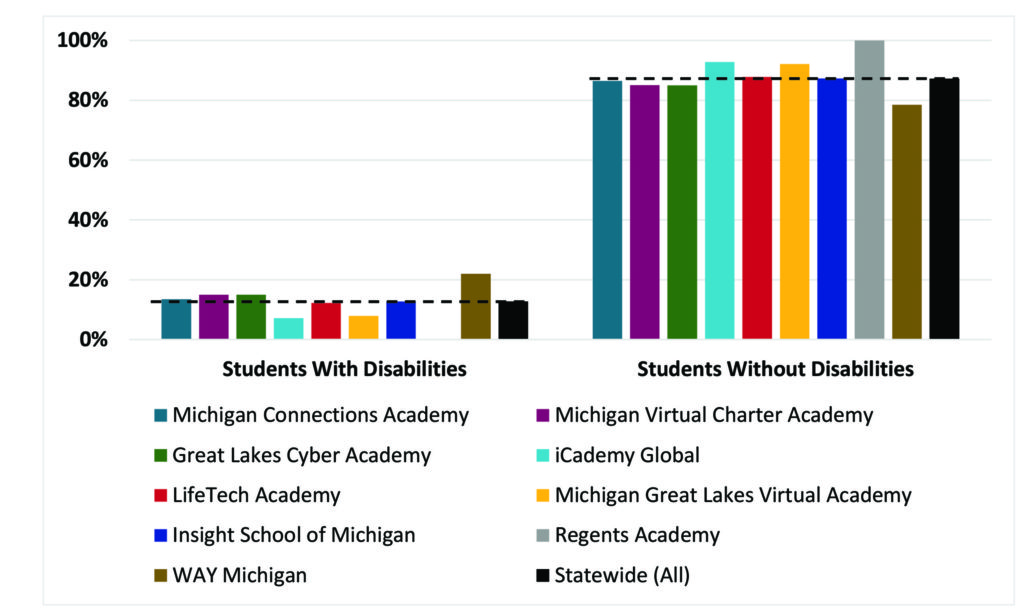
National Finding #4 – Virtual schools had a similar number of students with disabilities.
Michigan Finding #4 – Based on data for the 2014-15 school year, four of the nine virtual schools had higher proportions of students with disabilities than the statewide average. See Figure 4.
Figure 4. Students with Disabilities Distribution of Michigan Cyber School Students by School
National Finding #5 – Virtual students had fewer students classified as English Language Learners.
Michigan Finding #5 – Based on data for the 2014-15 school year, all nine virtual schools had fewer students classified as English Language Learners than the statewide average. See Figure 5.
Figure 5. English Language Learner Distribution of Michigan Cyber School Students by School
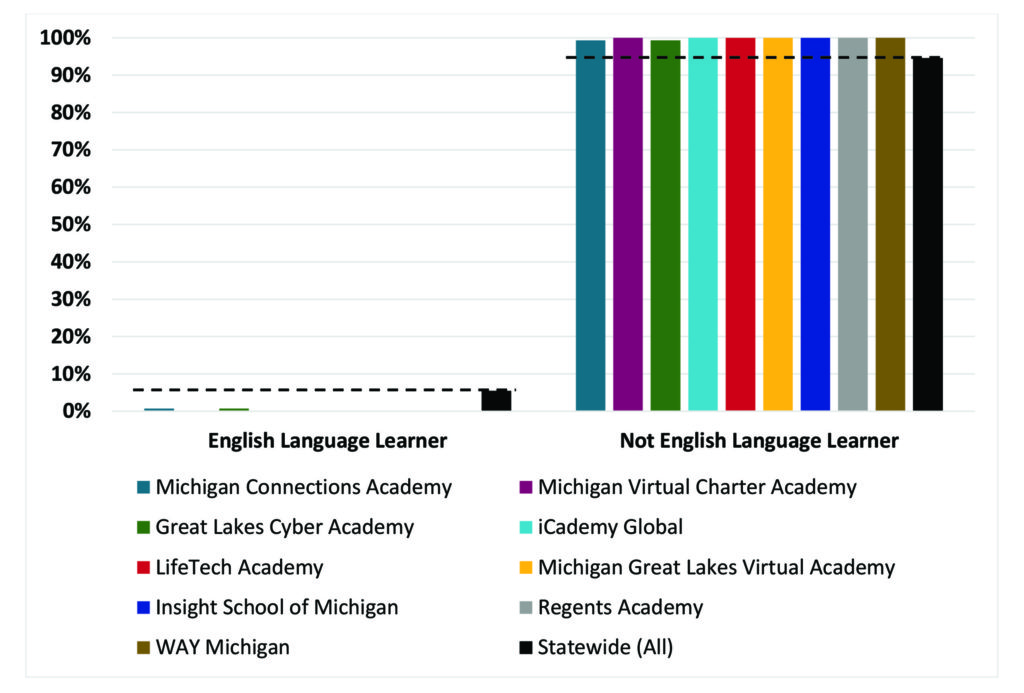
In conclusion, the national trends that more females are being served by virtual schools, fewer minority students are enrolled in virtual schools, and virtual school students are less likely to be classified as English Language Learners appear to be true for virtual schools in Michigan for the 2014-15 school year. In contrast to the national trend, Michigan appears to have virtual schools that served higher percentages of low-income students than the statewide average and six out of the nine virtual schools had rates similar to or higher than the state average of students with disabilities. It is important to remain mindful of the differences between national and state-level trends and observe the shifting of those trends over time.
